Bacillus subtilis Protects Public Goods by Extending Kin Discrimination to Closely Related Species
- PMID: 28679746
- PMCID: PMC5573675
- DOI: 10.1128/mBio.00723-17
Bacillus subtilis Protects Public Goods by Extending Kin Discrimination to Closely Related Species
Abstract
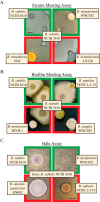
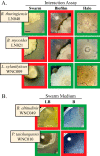
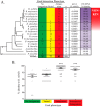
Kin discrimination systems are found in numerous communal contexts like multicellularity and are theorized to prevent exploitation of cooperative behaviors. The kin discrimination system in Bacillus subtilis differs from most other such systems because it excludes nonkin cells rather than including kin cells. Because nonkin are the target of the system, B. subtilis can potentially distinguish degrees of nonkin relatedness, not just kin versus nonkin. We examined this by testing a large strain collection of diverse Bacillus species against B. subtilis in different multicellular contexts. The effects of kin discrimination extend to nearby species, as the other subtilis clade species were treated with the same antagonism as nonkin. Species in the less-related pumilus clade started to display varied phenotypes but were mostly still discriminated against, while cereus clade members and beyond were no longer subject to kin discrimination. Seeking a reason why other species are perceived as antagonistic nonkin, we tested the ability of B. subtilis to steal communally produced surfactant from these species. We found that the species treated as nonkin were the only ones that made a surfactant that B. subtilis could utilize and that nonkin antagonism prevented such stealing when the two strains were mixed. The nonkin exclusion kin discrimination method thus allows effective protection of the cooperative behaviors prevalent in multicellularity while still permitting interactions with more distant species that are not a threat.IMPORTANCE Multicellular systems like bacterial biofilms and swarms rely on cooperative behaviors that could be undermined by exploitative invaders. Discriminating kin from nonkin is one way to help guard against such exploitation but has thus far been examined only intraspecifically, so the phylogenetic range of this important trait is unknown. We tested whether Bacillus subtilis treats other species as nonkin by testing a single strain against a diverse collection of Bacillus isolates. We found that the species in the same clade were treated as nonkin, which then lessened in more distant relatives. Further experiments showed that these nonkin species produced a cooperative good that could be stolen by B. subtilis and that treating each other as nonkin largely prevented this exploitation. These results impact our understanding of interspecies interactions, as bacterial populations can interact only after they have diverged enough to no longer be a threat to their cooperative existences.
Keywords: antagonism; cell-cell interaction; evolution; microbial ecology.
Copyright © 2017 Lyons and Kolter.
Figures


Similar articles
-
Social behaviours by Bacillus subtilis: quorum sensing, kin discrimination and beyond.Mol Microbiol. 2018 Dec;110(6):863-878. doi: 10.1111/mmi.14127. Epub 2018 Nov 1. Mol Microbiol. 2018. PMID: 30218468 Free PMC article. Review.
-
Kin discrimination between sympatric Bacillus subtilis isolates.Proc Natl Acad Sci U S A. 2015 Nov 10;112(45):14042-7. doi: 10.1073/pnas.1512671112. Epub 2015 Oct 5. Proc Natl Acad Sci U S A. 2015. PMID: 26438858 Free PMC article.
-
Kin Discrimination Modifies Strain Distribution, Spatial Segregation, and Incorporation of Extracellular Matrix Polysaccharide Mutants of Bacillus subtilis Strains into Mixed Floating Biofilms.Appl Environ Microbiol. 2022 Sep 22;88(18):e0087122. doi: 10.1128/aem.00871-22. Epub 2022 Sep 12. Appl Environ Microbiol. 2022. PMID: 36094206 Free PMC article.
-
Nonkin interactions between Bacillus subtilis soil isolates limit the spread of swarming deficient cheats.ISME J. 2024 Jan 8;18(1):wrae199. doi: 10.1093/ismejo/wrae199. ISME J. 2024. PMID: 39375016 Free PMC article.
-
Evolved Biofilm: Review on the Experimental Evolution Studies of Bacillus subtilis Pellicles.J Mol Biol. 2019 Nov 22;431(23):4749-4759. doi: 10.1016/j.jmb.2019.02.005. Epub 2019 Feb 12. J Mol Biol. 2019. PMID: 30769118 Review.
Cited by
-
Kin discrimination drives territorial exclusion during Bacillus subtilis swarming and restrains exploitation of surfactin.ISME J. 2022 Mar;16(3):833-841. doi: 10.1038/s41396-021-01124-4. Epub 2021 Oct 14. ISME J. 2022. PMID: 34650232 Free PMC article.
-
A Dual-Species Biofilm with Emergent Mechanical and Protective Properties.J Bacteriol. 2019 Aug 22;201(18):e00670-18. doi: 10.1128/JB.00670-18. Print 2019 Sep 15. J Bacteriol. 2019. PMID: 30833350 Free PMC article.
-
Biosurfactants Produced by Phyllosphere-Colonizing Pseudomonads Impact Diesel Degradation but Not Colonization of Leaves of Gnotobiotic Arabidopsis thaliana.Appl Environ Microbiol. 2021 Apr 13;87(9):e00091-21. doi: 10.1128/AEM.00091-21. Print 2021 Apr 13. Appl Environ Microbiol. 2021. PMID: 33608298 Free PMC article.
-
Annulment of Bacterial Antagonism Improves Plant Beneficial Activity of a Bacillus velezensis Consortium.Appl Environ Microbiol. 2022 Apr 26;88(8):e0024022. doi: 10.1128/aem.00240-22. Epub 2022 Apr 5. Appl Environ Microbiol. 2022. PMID: 35380452 Free PMC article.
-
Social behaviours by Bacillus subtilis: quorum sensing, kin discrimination and beyond.Mol Microbiol. 2018 Dec;110(6):863-878. doi: 10.1111/mmi.14127. Epub 2018 Nov 1. Mol Microbiol. 2018. PMID: 30218468 Free PMC article. Review.
References
MeSH terms
Substances
Grants and funding
LinkOut - more resources
Full Text Sources
Other Literature Sources
