. 2024 Sep 14;13(18):1552.
doi: 10.3390/cells13181552.

Spectral Algal Fingerprinting and Long Sequencing in Synthetic Algal-Microbial Communities

Affiliations

Spectral Algal Fingerprinting and Long Sequencing in Synthetic Algal-Microbial Communities

Ayagoz Meirkhanova et al. Cells. .

Abstract

Synthetic biology has advanced in creating artificial microbial and algal communities, but technical and evolutionary complexities still pose significant challenges. Traditional methods, like microscopy and pigment analysis, are limited in throughput and resolution. In contrast, advancements in full-spectrum cytometry enabled high-throughput, multidimensional analysis of single cells based on size, complexity, and spectral fingerprints, offering more precision and flexibility than conventional flow cytometry. This study uses full-spectrum cytometry to analyze synthetic algal-microbial communities, enabling rapid species identification and enumeration. The workflow involves recording individual spectral signatures from monocultures, using autofluorescence to capture populations of interest, and creating a spectral library for further analysis. This spectral library was used for the analysis of the synthetic phytoplankton communities, revealing differences in spectral signatures. Moreover, the synthetic consortium experiment monitored algal growth, comparing results from different instruments, highlighting the advantages of the spectral virtual filter system for precise population separation and abundance tracking. By capturing the entire emission spectrum of each cell, this method enhances understanding of algal-microbial community dynamics and responses to environmental stressors. The development of standardized spectral libraries would improve the characterization of algal communities, further advancing synthetic biology and phytoplankton ecology research.

Keywords: imaging flow cytometry; long sequencing; nanopore-based sequencing; spectral flow cytometry; synthetic algal–microbial communities.


Conflict of interest statement

The authors declare no conflicts of interest.

Figures
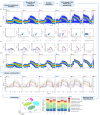
Figure 1
Figure 1
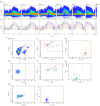
Schematic overview of the proposed experimental workflow for the analysis combining full-spectrum cytometry and sequencing. The workflow involves parallel analysis of obtained samples using a MinION Mk1C-based sequencing platform (ONT) and ID7000 spectral cell analyzer (Sony Biotechnology). The first step in the analysis of spectral data requires (a) recording and isolation of single spectral signatures, for which the“Autofluorescence Finder” tool is utilized. During this step (b), a set of optimal virtual filters for discrimination autofluorescent populations is determined. As defined using the tool, AF-A corresponds to Microcystis sp. and AF-B to debris within the sample; (c) respective emission spectra of two defined autofluorescent populations displayed below (red line—AF-A, blue line—AF-B). (d) Single spectral signature is then extracted, and (e) a library containing unique spectral signatures corresponding to respective phytoplankton species is then constructed and utilized during subsequent analysis, including unsupervised clustering techniques (e.g., t-SNE).
Figure 2
Figure 2
Discrimination of cyanobacteria in a synthetic mix based on autofluorescence. (a) Ribbon plot demonstrating combined spectral signatures of three cyanobacterial representatives across 7 excitation lasers: Synechococcus sp., Synechocystis sp., and Microcystis sp. (b) Overlay plot of individual spectral signatures for each cyanobacterial representative; red regions indicate regions of interest, used for setting an optimal pair of VFs. (c) Dot plot of [VF-637]_A against [VF-488]_A with two autofluorescent populations identified: Synechocystis sp., population A was then plotted with [VF-561]_A against SSC_A to resolve two subpopulations of Microcystis sp. and Synechococcus sp. (d) Scatter plot (FSC_A against SSC_A) demonstrates relative position of each identified cyanobacterial species. Color coding: (Synechococcus sp.—blue, Synechocystis sp.—violet, and Microcystis sp.—red).
Figure 3
Figure 3
Gating strategy for discrimination of 14 groups of phytoplankton species based on autofluorescence in a complex synthetic mix. (a) Ribbon plot demonstrating combined spectral signatures of 16 phytoplankton species across 7 excitation lasers. (b) Overlay plot of individual spectral signatures for each phytoplankton representative. (c) Gating strategy for discrimination of each subpopulation within the synthetic mix: 1—Chlorophyta (Chlorella vulgaris and Acutodesmus obliquus), 2—Euglena sanguinea, 3—Peridinium sp., 4—Cryptomonas sp., 5—Fragilaria sp., 6—Haematococcus pluvialis, 7—Chroothece richteriana, 8—Porphyridium cruentum cf., 9—filamentous Cyanobacteria (Dolichospermum urugayensis and Nodularia sphaerocarpa), 10—Chroomonas sp., 11—Synechocystis sp., 12—Gloeobacter violaceus, 13—Microcystis sp., and 14—Synechococcus sp.
Figure 4
Figure 4
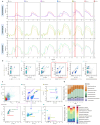
Tracking temporal changes in synthetic community composition. (a) Overlay plot of individual spectral signatures for each phytoplankton group representative (Cyanobacteria: violet—Microcystis sp., red—Synechococcus sp., blue—Synechocystis sp.; Chlorophyta: yellow—Scherffelia dubia, orange—Chlamydomonas sp., green—Haematococcus pluvialis; Cryptophyta: pink—Chroomonas sp., blue—Rhodomonas sp., green—Cryptomonas sp.); red regions indicate regions of interest, used for setting an optimal pair of VFs. (b) “Autofluorescence Finder” tool with VFs set to regions of interest, demonstrating the best separation of subpopulations on [VF-320_A] vs. [VF-561_A] plot (highlighted in red) (c) The gating strategy, composed of sequential sub-gating steps, used to identify phytoplankton subpopulations within the synthetic community; colored scatter dot plot demonstrates each of identified algal populations. (d) Changes in the relative abundance of the artificial mix subpopulations during the nine-day experiment. (e) Top ten most abundant bacterial species during the last day of the experiment in triplicates revealed through full-length 16S rRNA sequencing.
Figure 5
Figure 5
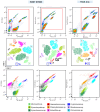
Identification of artificial mix subpopulations compared between SONY ID700 spectral cell analyzer and BD FACSAria SORP cytometer. Subpopulations of interest were first gated on the plots (red region) to eliminate debris. The first column represents data recorded on SONY ID7000 using a set of VFs best optimized for artificial mix discrimination. Opt-SNE demonstrates successful discrimination of the 9 subpopulations within the mix based on VF data. The second column represents data recorded on SONY ID7000 using a set of VFs matching optical filters used on BD FACSAria. Similarly, all 9 subpopulations were discriminated. The last column represents data recorded on BD FACSAria. Based on the optical configuration of the instrument, only 8 subpopulations were identified using opt-SNE.
Figure 6
Figure 6
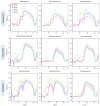
Overlay plots for each phytoplankton species within a synthetic mix across 7 excitation lasers to demonstrate the variability of emission signal for each excitation source. The first row demonstrates overlay plots for Cyanobacteria representatives, second—Chlorophyta, and third—Cryptophyta.

Similar articles

References

    1. Deng Y., Mauri M., Vallet M., Staudinger M., Allen R.J., Pohnert G. Dynamic Diatom-Bacteria Consortia in Synthetic Plankton Communities. Appl. Environ. Microbiol. 2022;88:e01619–e01622. doi: 10.1128/aem.01619-22. - DOI - PMC - PubMed
    1. Fu H., Uchimiya M., Gore J., Moran M.A. Ecological Drivers of Bacterial Community Assembly in Synthetic Phycospheres. Proc. Natl. Acad. Sci. USA. 2020;117:3656–3662. doi: 10.1073/pnas.1917265117. - DOI - PMC - PubMed
    1. Hartwell L.H., Hopfield J.J., Leibler S., Murray A.W. From Molecular to Modular Cell Biology. Nature. 1999;402:C47–C52. doi: 10.1038/35011540. - DOI - PubMed
    1. Andersen R.A. Algal Culturing Techniques. Elsevier; Amsterdam, The Netherlands: 2005.
    1. De-Bashan L.E., Bashan Y., Moreno M., Lebsky V.K., Bustillos J.J. Increased Pigment and Lipid Content, Lipid Variety, and Cell and Population Size of the Microalgae Chlorella Spp. When Co-Immobilized in Alginate Beads with the Microalgae-Growth-Promoting Bacterium Azospirillum Brasilense. Can. J. Microbiol. 2002;48:514–521. doi: 10.1139/w02-051. - DOI - PubMed

Publication types

MeSH terms

Grants and funding

LinkOut - more resources