. 2024 May 31;10(22):eadn2789.
doi: 10.1126/sciadv.adn2789. Epub 2024 May 29.

A molecular switch controls assembly of bacterial focal adhesions

Affiliations

A molecular switch controls assembly of bacterial focal adhesions

Bouchra Attia et al. Sci Adv. .

Abstract

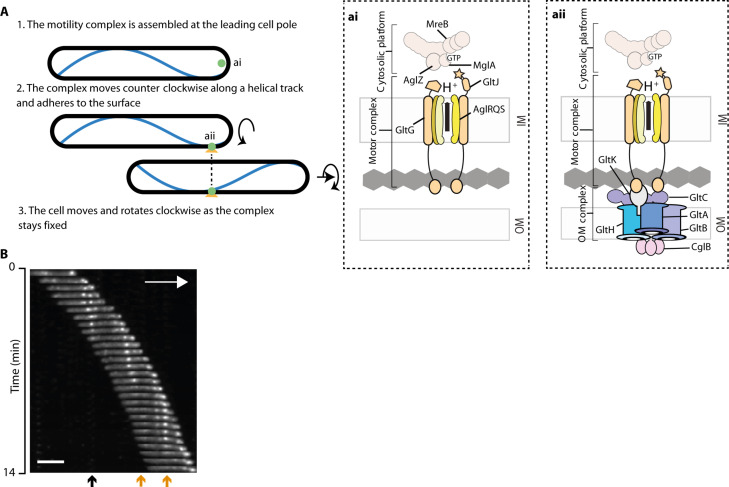
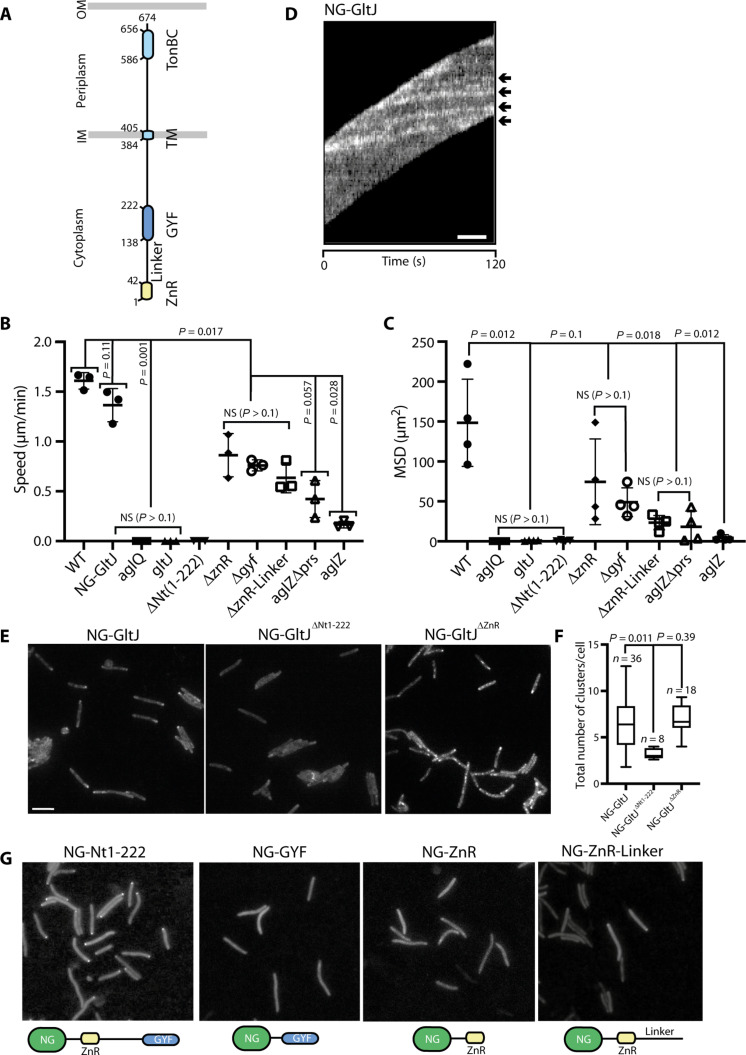
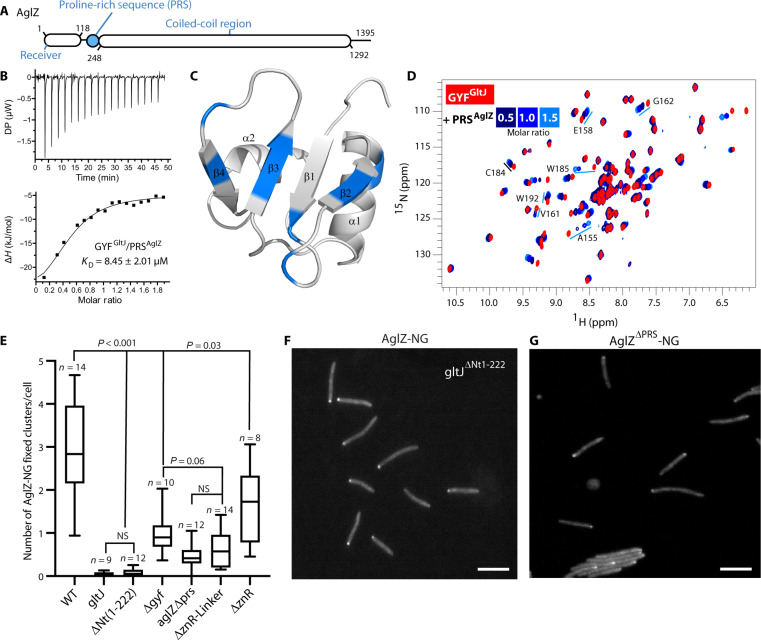
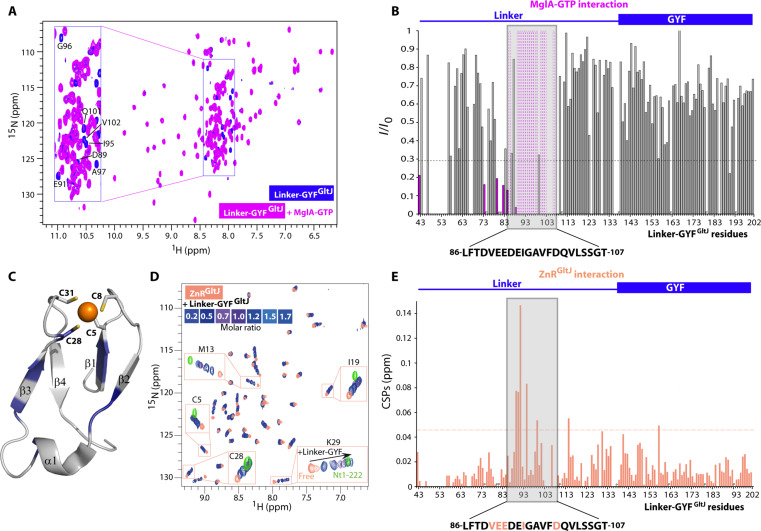
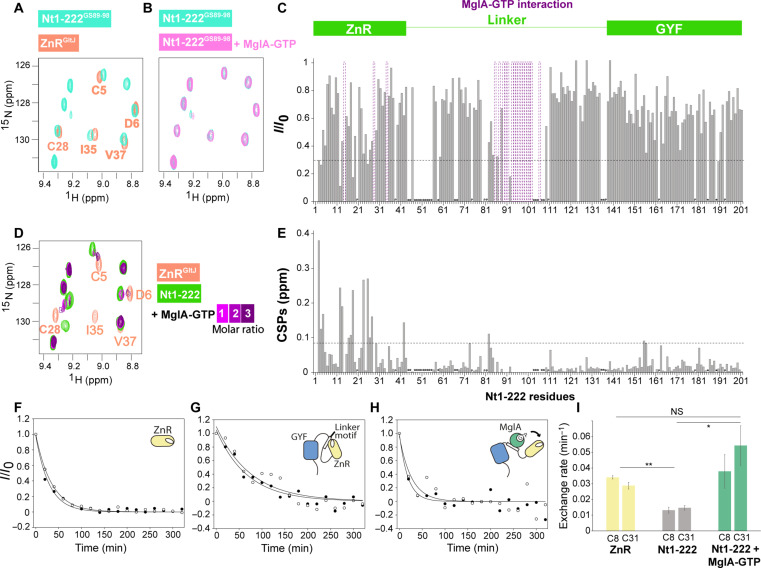
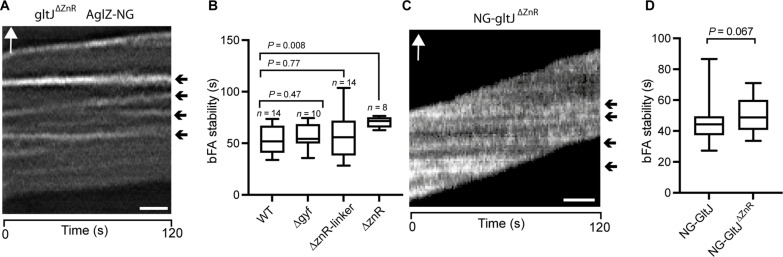
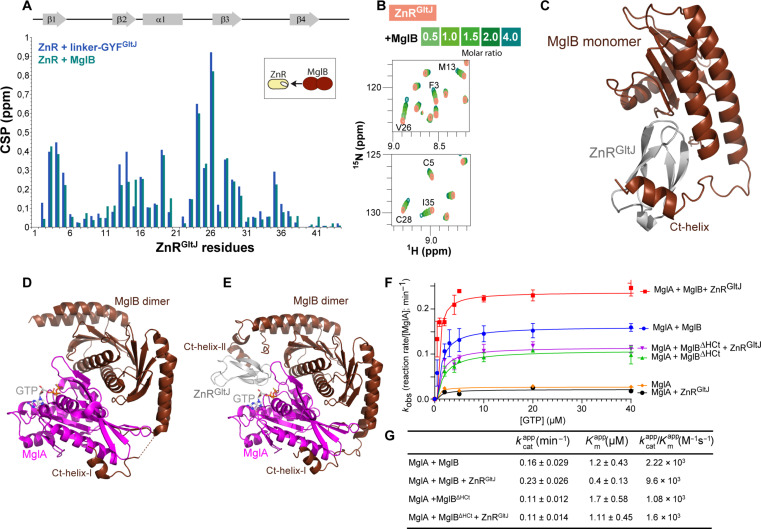
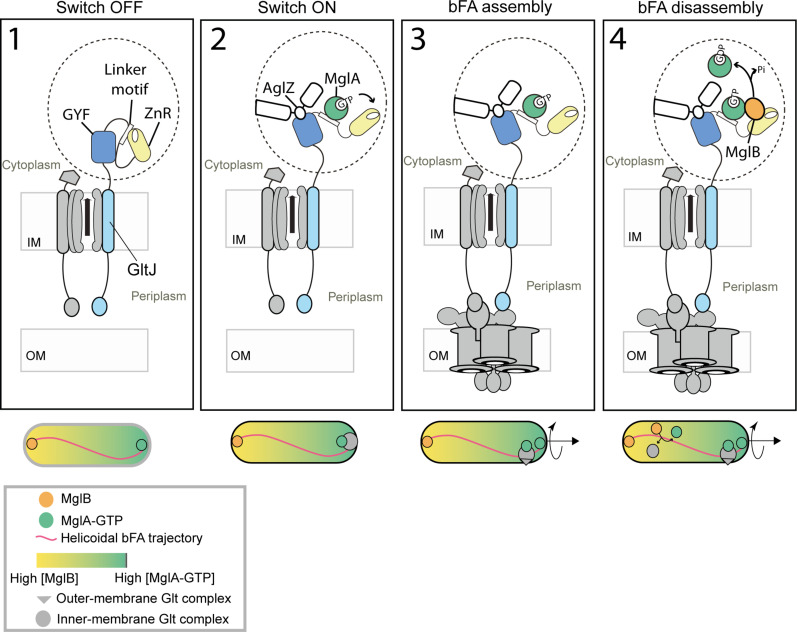
Cell motility universally relies on spatial regulation of focal adhesion complexes (FAs) connecting the substrate to cellular motors. In bacterial FAs, the Adventurous gliding motility machinery (Agl-Glt) assembles at the leading cell pole following a Mutual gliding-motility protein (MglA)-guanosine 5'-triphosphate (GTP) gradient along the cell axis. Here, we show that GltJ, a machinery membrane protein, contains cytosolic motifs binding MglA-GTP and AglZ and recruiting the MreB cytoskeleton to initiate movement toward the lagging cell pole. In addition, MglA-GTP binding triggers a conformational shift in an adjacent GltJ zinc-finger domain, facilitating MglB recruitment near the lagging pole. This prompts GTP hydrolysis by MglA, leading to complex disassembly. The GltJ switch thus serves as a sensor for the MglA-GTP gradient, controlling FA activity spatially.


Figures

Fig. 1.
Fig. 1.. Dynamics of the M. xanthus motility complex.
(A) Proposed architecture of the motility complex and mechanism of propulsion. (ai) Proposed structure of the trafficking motor complex in nonadhered mobile clusters. The motility complex is assembled at the leading cell pole by recruitment of the IM motors (GltJ, GltG, and AglRQS) to the cytosolic platform formed by the AglZ, MglA, and MreB proteins. This complex uses the proton-motive force to move directionally to the lagging cell pole in a counterclockwise rotational trajectory, until it becomes immobilized at bFA. (aii) Interaction between the IM motor and a complex of OM proteins containing the CglB adhesin is proposed to connect the trafficking complex to the underlying substratum and form bFAs. The motility complex becomes fixed as OM adhesive complex treadmill through the IM motor via proton-motive force (pmf)-driven interaction cycles. The cell moves, rotating along its long axis in the clockwise direction. (B) Myxococcus bFAs containing AglZ-NG imaged by epifluorescence. Fixed clusters are formed at the leading cell pole and either disperse when they reach the lagging cell pole (black arrow) or disperse along the cell body (orange arrows). White arrow indicates the direction of movement. Pictures were taken every 30 s. Scale bar, 2 μm.
Fig. 2.
Fig. 2.. The GltJ protein is essential for bFA formation.
(A) Domain organization of GltJ and predicted topology in the cell envelope. (B) Single-cell speeds of gltJ and aglZ mutant strains. Each data point corresponds to the mean of the speeds obtained for single cells across four technical replicates, an experiment repeated three times for each strain. The statistics were obtained applying a Welch’s t test. Significance is assumed for P < 0.1. NS, not significant. (C) Mean square displacement (MSD) of single cells of gltJ and aglZ mutant strains. The MSD was calculated as a proxy for directed single cell movements across a time period of 30 min (see Materials and Methods). Each data point corresponds to the mean of the MSD obtained for single cells across four technical replicates, an experiment repeated four times for each strain. The statistics were obtained as in (B). (D) Localization of NG-GltJ in a motile cell. Shown is a time-lapse (one image every 4 s) and derived kymograph of the same cell (one image every 1 s). The black arrows point to fixed clusters. Scale bar, 2 μm. (E) GltJ polar localization and localization to bFAs. Example images of NG fusions of GltJ and mutants are shown for each fusion. Scale bar, 4 μm. (F) Formation of GltJ clusters in cells expressing GltJ variants. Shown is the total number of GltJ-NG clusters (polar and intracellular) per cell scored in n replicates across four independent experiments. The statistics were obtained applying a Wilcoxon test. Significance is assumed for P < 0.1. (G) Polar determinants in the GltJ Nt1-222 region. NG fusions to various motifs of the GltJ Nt1-222 region were expressed in a gltJ mutant background and tested for localization. Example images are shown for each construct. Scale bars, 3 μm.
Fig. 3.
Fig. 3.. GYFGltJ interacts with the PRS of AglZ through a noncanonical binding interface.
(A) Domain organization of AglZ. (B) ITC binding assay with GYFGltJ and PRSAglZ. DP, differential power. (C) Representative solution structure of the GYFGltJ domain (NMR ensembles of the 20 conformers with the lowest energy are shown in fig. S6B). Secondary structures are labeled. The protein residues involved in the PRSAglZ binding are displayed in blue. (D) 1H,15N heteronuclear single quantum coherence (HSQC) spectra, representing all H-N correlations of 0.1 mM 15N-labeled GYFGltJ-free (red) and upon titration of increasing concentrations of PRSAglZ are shown (dark to light blue). For comparison, selected resonances of GYFGltJ showing the strongest CSPs upon PRSAglZ addition are reported. ppm, parts per million. (E) bFA activity in GltJ and AglZ mutants. For each strain, the number of active bFAs was determined by tracking individual bFAs in single cells in n replicates across four independent experiments. The statistics were obtained applying a Wilcoxon test. Significance is assumed for P < 0.1. (F) The GltJ N-terminal region is required for bFA formation. Scale bar, 4 μm. (G) The AglZ PRS motif is required for bFA formation but not for polar localization. Scale bar, 4 μm.
Fig. 4.
Fig. 4.. MglA and ZnRGltJ interact with LinkerGltJ.
(A) Overlay of the 1H,15N HSQCs of 15N-labeled Linker-GYFGltJ free (blue) and bound to MglA-GTP (magenta). Left: Inset shows expanded central part of Linker-GYFGltJ spectra. Peaks disappearing upon MglA-GTP interaction are labeled. (B) Relative peak intensities (I/I0) of NMR signals of Linker-GYFGltJ in complex with MglA-GTP. Resonances experiencing strong peak intensity decrease are indicated by magenta bars. Bars with magenta dashed edges indicate disappearing resonances upon interaction. The absence of bars indicates residues that could not be assigned, and P letters specify proline position. Dashed line represents 1σ from the average I/I0. The main perturbed region is framed in gray, and the corresponding sequence is shown below the plot. (C) Representative solution structure of the ZnRGltJ domain. Secondary structures are labeled as well as the cysteine side chains chelating the zinc ion (orange sphere). The protein residues involved in LinkerGltJ binding are displayed in blue. (D) 1H,15N-HSQC series of 15N-labeled ZnRGltJ-free (salmon) and upon addition of an increasing amount of Linker-GYFGltJ (blue shades). Insets show selected resonances experiencing strong chemical shift variations in the presence of the Linker-GYFGltJ with, in addition, the corresponding resonance in the 1H,15N HSQC of the Nt1-222 construct (green peaks). Residues experiencing CSPs are reported on ZnRGltJ structure [shown in (C)]. (E) Combined CSPs between 1H,15N resonances of the free and ZnRGltJ-bound state of Linker-GYFGltJ (at 1.7 molar ratio). The absence of bars indicates residues that could not be assigned, and P letters specify the position of a proline. Dashed line represents 1σ from the average CSPs. The main region perturbed upon MglA-GTP interaction with Linker-GYFGltJ is framed in gray as in (B). Residues within this region experiencing CSPs upon ZnRGltJ binding are colored salmon in the sequence.
Fig. 5.
Fig. 5.. MglA-GTP competes with ZnRGltJ for LinkerGltJ binding.
(A) Spectrum region showing the overlay of 1H,15N HSQC spectrum of 15N-labeled Nt1-222GS89–98 (mint), a modified Nt1-222 in which the D89-V98 region has been substituted by a poly-GS sequence, with the spectrum of free ZnRGltJ (salmon). (B) Same spectrum region as in (A) showing the overlay of 1H,15N HSQC spectra of Nt1-222GS89–98 in absence (mint) and in presence of MglA-GTP (pink). (C) Normalized peak intensity ratio (I/I0) analysis of Nt1-222/MglA-GTP interaction. Bars with purple dashed edges indicate peaks disappearing upon MglA-GTP interaction. Above the plot is shown the ZnR and GYF domain limits within Nt1-222. (D) Spectrum region of the 1H,15N HSQCs of 15N-labeled Nt1-222 free (green) and after addition of 1 (magenta), 2 (light purple), and 3 (purple) molar ratios of MglA-GTP. 1H,15N HSQC of free ZnRGltJ (salmon) is also superimposed. Resonances shown correspond to ZnRGltJ [same resonances shown in (A) and (B)]. (E) Combined CSPs of Nt1-222 bound to MglA-GTP. (F to H) Disappearance over time of 1H,15N HSQC cross-peaks from cysteines C8 (open circles) and C31 (filled circles) of Zn2+-ZnRGltJ (F), Zn2+–Nt1-222 (G), and Zn2+–Nt1-222 in the presence of MglA-GTP (H) upon incubation with Cd2+. (I) Metal exchange rates derived from the experiments shown in (F), (G), and (H). The statistics were obtained applying a Student’s t test. Significance is assumed for P < 0.05.
Fig. 6.
Fig. 6.. The LinkerGltJ region and the ZnRGltJ domain are functional in vivo.
(A) AglZ-NG forms highly stable bFAs in a GltJΔZnR-expressing strain. Shown is a kymograph of a single cell with images captured every 1 s for 120 s. Scale bar, 1 μm. (B) AglZ-containing bFA stability in GltJ mutant–expressing strains. For each strain, the stability of individual bFAs was tracked in single cells. For each strain, the mean cluster stability was determined for n replicates across four independent experiments. The statistics were obtained applying a Wilcoxon test. Significance is assumed for P < 0.1. (C) NG-GltJΔZnR forms highly stable clusters. Shown is a kymograph of a single cell with images captured every 1 s for 120 s. Scale bar, 1 μm. (D) bFA stability in NG-GltJ and NG-GltJΔZnR strains. For each strain, the stability of individual bFAs was tracked in single cells. For each strain, the mean cluster stability was determined for n replicates across four independent experiments. The statistics were obtained applying a Wilcoxon test. Significance is assumed for P < 0.1.
Fig. 7.
Fig. 7.. ZnRGltJ interacts with MglB.
(A) Combined CSPs between 1H,15N resonances of the free ZnRGltJ and upon binding to Linker-GYFGltJ (blue bars) or MglB (blue-green bars). The secondary structures of ZnRGltJ are indicated above the plot. (B) Spectrum regions of 1H,15N HSQC series of 15N-labeled ZnRGltJ free (salmon) and upon addition of increasing amounts of MglB (green shades) up to four molar excess. (C) AlphaFold structure p4rediction of the MglB/ZnRGltJ complex. (D) Crystal structure of MglA–guanosine 5′-O-(3′-thiotriphosphate) (GTP-γ-S) bound to MglB homodimer [Protein Data Bank (PDB) ID: 6IZW] (28). (E) AlphaFold structure prediction of the MglA/MglB dimer/ZnRGltJ complex. The GTP-γ-S position was inferred by homology to the structure of MglA–GTP-γ-S/MglB dimer shown in (D). (F) Initial rate data for Pi release at different concentration of GTP in presence of MglA (orange), MglA + MglB (blue), MglA + MglB + ZnRGltJ (red), MglA + MglBΔHCt (green), and MglA + MglBΔHCt + ZnRGltJ (purple). (G) Kinetic parameters table. Initial rate data were fitted to the Michaelis-Menten equation. The assays were performed using constant concentration of proteins (MglA, 2 μM; MglB and MglBΔHCt, 4 μM; ZnRGltJ, 8 μM) and a range of GTP concentrations (0.5 to 100 μM).
Fig. 8.
Fig. 8.. Dynamic assembly of the Agl-Glt complex in motile Myxococcus cells.
The upper cartoon depicts the proposed activation/deactivation mechanism of bFAs via connection of the Agl-Glt machinery to the cytoplasmic platform by the GltJ three motifs N-terminal region. For clarity purposes, additional interactions such as MglA/AglZ and MglA/MreB have been omitted. Although it is clear that these interactions are important for bFA assembly, how they integrate with the switch remains to be determined. The lower cartoon represents the cellular location of GltJ-containing complexes for each step of the proposed model. The MglA-MglB proposed concentration gradient within the cell is represented as an orange to green color gradient along the cell axis. 1. When the Agl-Glt complex is inactive and not connected to AglZ and MglA, the switch is OFF, and the ZnR domain is in the closed state through interaction with the Linker motif. 2. At the leading cell pole, the Agl-Glt complex becomes activated via the independent docking of the GYFGltJ domain to AglZ and the Linker motif to MglA-GTP, and the ZnR switch is in the free ON conformation. The complex can thus move toward the lagging cell pole. 3. In the front of the cell where MglA concentrations are high, motility IM complexes form bFAs when they interact with the OM complex and thus adhere to the underlying substratum. 4. At the back of the cell where MglB concentration is higher possibly because of the MglA-GTP gradient, MglB is recruited by the ZnRGltJ and exerts its GAP activity to convert MglA to the GDP-bound state that cannot bind the Linker motif and thus dissociates from GltJ. Ultimately, this regulation leads to the release of the cytoplasmic platform and back to step 1.

Similar articles

Cited by

References

    1. Wozniak M. A., Modzelewska K., Kwong L., Keely P. J., Focal adhesion regulation of cell behavior. Biochim. Biophys. Acta 1692, 103–119 (2004). - PubMed
    1. Charest P. G., Firtel R. A., Big roles for small GTPases in the control of directed cell movement. Biochem. J. 401, 377–390 (2007). - PMC - PubMed
    1. De Pascalis C., Etienne-Manneville S., Single and collective cell migration: The mechanics of adhesions. MBoC 28, 1833–1846 (2017). - PMC - PubMed
    1. Faure L. M., Fiche J.-B., Espinosa L., Ducret A., Anantharaman V., Luciano J., Lhospice S., Islam S. T., Tréguier J., Sotes M., Kuru E., Van Nieuwenhze M. S., Brun Y. V., Théodoly O., Aravind L., Nollmann M., Mignot T., The mechanism of force transmission at bacterial focal adhesion complexes. Nature 539, 530–535 (2016). - PMC - PubMed
    1. Luciano J., Agrebi R., Le Gall A. V., Wartel M., Fiegna F., Ducret A., Brochier-Armanet C., Mignot T., Emergence and modular evolution of a novel motility machinery in bacteria. PLOS Genet. 7, e1002268 (2011). - PMC - PubMed

MeSH terms