Ecosystem size-induced environmental fluctuations affect the temporal dynamics of community assembly mechanisms
- PMID: 35982230
- PMCID: PMC9666552
- DOI: 10.1038/s41396-022-01286-9
Ecosystem size-induced environmental fluctuations affect the temporal dynamics of community assembly mechanisms
Abstract
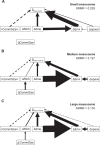
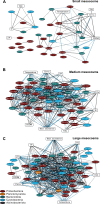
Understanding processes that determine community membership and abundance is important for many fields from theoretical community ecology to conservation. However, spatial community studies are often conducted only at a single timepoint despite the known influence of temporal variability on community assembly processes. Here we used a spatiotemporal study to determine how environmental fluctuation differences induced by mesocosm volumes (larger volumes were more stable) influence assembly processes of aquatic bacterial metacommunities along a press disturbance gradient. By combining path analysis and network approaches, we found mesocosm size categories had distinct relative influences of assembly process and environmental factors that determined spatiotemporal bacterial community composition, including dispersal and species sorting by conductivity. These processes depended on, but were not affected proportionately by, mesocosm size. Low fluctuation, large mesocosms primarily developed through the interplay of species sorting that became more important over time and transient priority effects as evidenced by more time-delayed associations. High fluctuation, small mesocosms had regular disruptions to species sorting and greater importance of ecological drift and dispersal limitation indicated by lower richness and higher taxa replacement. Together, these results emphasize that environmental fluctuations influence ecosystems over time and its impacts are modified by biotic properties intrinsic to ecosystem size.
© 2022. The Author(s).
Conflict of interest statement
The authors declare no competing interests.
Figures


Similar articles
-
Integrating species traits into species pools.Ecology. 2018 Jun;99(6):1265-1276. doi: 10.1002/ecy.2220. Ecology. 2018. PMID: 29569239 Review.
-
Community assembly and the functioning of ecosystems: how metacommunity processes alter ecosystems attributes.Ecology. 2017 Apr;98(4):909-919. doi: 10.1002/ecy.1697. Ecology. 2017. PMID: 27984663
-
The spatial synchrony of species richness and its relationship to ecosystem stability.Ecology. 2021 Nov;102(11):e03486. doi: 10.1002/ecy.3486. Epub 2021 Aug 12. Ecology. 2021. PMID: 34289105 Free PMC article.
-
Grazers structure the bacterial and algal diversity of aquatic metacommunities.Ecology. 2016 Dec;97(12):3472-3484. doi: 10.1002/ecy.1612. Ecology. 2016. PMID: 27912021
-
Factors influencing aquatic and terrestrial bacterial community assembly.Environ Microbiol Rep. 2019 Jun;11(3):306-315. doi: 10.1111/1758-2229.12731. Epub 2019 Jan 22. Environ Microbiol Rep. 2019. PMID: 30618071 Review.
Cited by
-
Microeukaryote community coalescence strengthens community stability and elevates diversity.FEMS Microbiol Ecol. 2024 Jul 12;100(8):fiae100. doi: 10.1093/femsec/fiae100. FEMS Microbiol Ecol. 2024. PMID: 39003240 Free PMC article.
-
Differential microbiome features in lake-river systems of Taihu basin in response to water flow disturbance.Front Microbiol. 2024 Sep 30;15:1479158. doi: 10.3389/fmicb.2024.1479158. eCollection 2024. Front Microbiol. 2024. PMID: 39411429 Free PMC article.
-
Core taxa drive microeukaryotic community stability of a deep subtropical reservoir after complete mixing.Environ Microbiol Rep. 2023 Dec;15(6):769-782. doi: 10.1111/1758-2229.13196. Epub 2023 Sep 9. Environ Microbiol Rep. 2023. PMID: 37688478 Free PMC article.
-
Contrasting response of microeukaryotic and bacterial communities to the interplay of seasonality and local stressors in shallow soda lakes.FEMS Microbiol Ecol. 2023 Aug 22;99(9):fiad095. doi: 10.1093/femsec/fiad095. FEMS Microbiol Ecol. 2023. PMID: 37586889 Free PMC article.
References
-
- Vellend M. Conceptual synthesis in community ecology. Q Rev Biol. 2010;85:183–206. - PubMed
-
- Leibold MA. Chase JM Metacommunity Ecology. Levin SA, Horn HS, editors: Princeton University Press, Princeton; 2018.
-
- Logue JB, Mouquet N, Peter H, Hillebrand H, Declerck P, Flohre A, et al. Empirical approaches to metacommunities: A review and comparison with theory. Trends Ecol Evol. 2011;26:482–91.. - PubMed
-
- Hanson CA, Fuhrman JA, Horner-Devine MC, Martiny JB. Beyond biogeographic patterns: Processes shaping the microbial landscape. Nat Rev Microbiol. 2012;10:497–506. - PubMed
-
- Lindström ES, Langenheder S. Local and regional factors influencing bacterial community assembly. Environ Microbiol Rep. 2012;4:1–9. - PubMed

