. 2022 Mar;603(7901):503-508.
doi: 10.1038/s41586-022-04416-7. Epub 2022 Mar 9.

Ribosome collisions induce mRNA cleavage and ribosome rescue in bacteria

Affiliations

Ribosome collisions induce mRNA cleavage and ribosome rescue in bacteria

Kazuki Saito et al. Nature. 2022 Mar.

Abstract

Ribosome rescue pathways recycle stalled ribosomes and target problematic mRNAs and aborted proteins for degradation1,2. In bacteria, it remains unclear how rescue pathways distinguish ribosomes stalled in the middle of a transcript from actively translating ribosomes3-6. Here, using a genetic screen in Escherichia coli, we discovered a new rescue factor that has endonuclease activity. SmrB cleaves mRNAs upstream of stalled ribosomes, allowing the ribosome rescue factor tmRNA (which acts on truncated mRNAs3) to rescue upstream ribosomes. SmrB is recruited to ribosomes and is activated by collisions. Cryo-electron microscopy structures of collided disomes from E. coli and Bacillus subtilis show distinct and conserved arrangements of individual ribosomes and the composite SmrB-binding site. These findings reveal the underlying mechanisms by which ribosome collisions trigger ribosome rescue in bacteria.


Conflict of interest statement

Competing Interests: The authors declare that there are no competing interests.

Figures

Extended Data Fig. 1:
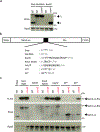
SmrB is a general ribosome rescue factor. a, Reporter protein from wild-type and ΔssrA strains was detected by antibodies against the N-terminal Strep-tag. Arrows indicate the full-length fusion protein (FL) and shorter NanoLuc protein (N). The RpoB protein serves as a loading control. b, Additional reporters to study ribosome rescue in E. coli with various stalling motifs. c, The expression of full-length NanoLuc-Ble protein was monitored with an anti-FLAG antibody; anti-Strep antibodies reveal both full-length NanoLuc-Ble and truncated NanoLuc protein. RpoB serves as a loading control.
Extended Data Fig. 2:
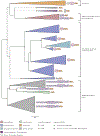
Phylogenetic tree of SMR domain proteins. Stylized phylogenetic tree depicting relationships between SMR domain clades. Clades with indicated bootstrap support are marked with circles. Clade names are given to the right of the tree. Dotted lines indicate positions with little or no bootstrap support.
Extended Data Fig. 3:
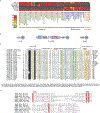
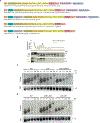
Distribution and architectures of SMR-domain proteins. a, Heat map demonstrating the conservation and distribution of SMR-domain proteins and other related translational quality control factors. Smr-all includes all types of SMR-domain proteins; Smr-euk includes only the eukaryotic branch. b, Domain organization of three representative bacterial proteins containing an SMR domain. c, Multiple alignment of the conserved regions in the N-terminal extension of SMR proteins from proteobacteria. Columns in the alignment are shaded and labeled according to biochemical character: -, negatively charged; h, hydrophobic in yellow; a, aromatic; p, polar in blue; l, aliphatic in yellow; s, small in green; u, tiny in green. Residue positions in the --xxxa motif are colored in white and shaded in black, marked by asterisks above the alignment. Residue positions forming part of the active site of the core SMR domain are colored in white and shaded in red. Sequences are labeled with NCBI accession number and organism abbreviation; abbreviations are provided below alignment. Secondary structure provided at top of alignment. Numbers to left and right of alignment denote positioning of the region. Internal numbers give the size of excised variable insert regions. d, Sequence alignment of SMR domains of representative proteins. Identical residues are shown in white with a red background; conserved residues are shown in red. The identity of each sequence is represented by the gene name, species name, and numbers indicating the beginning and the end of the residues used for the alignment. Ecol, Escherichia coli; Scer, Saccharomyces cerevisiae; Cele, Caenorhabditis elegans; Hsap, Homo sapiens; Atha, Arabidopsis thaliana; Bsub, Bacillus subtilis.
Extended Data Fig. 4:
SmrB cleavage, tmRNA tagging, and ribosome collisions. a, The results of 5’-RACE showing the 5’-ends of downstream fragments in reads per million on the EP* reporter. The first nt in the A site codon in the stall motif is designated as zero. b, The results of 3’-RACE showing the 3’-ends of upstream fragments. c, tmRNA tagging sites on the EP* reporter in the wild-type and ΔsmrB strains, corresponding to the residue immediately preceding the tmRNA tag in peptide sequences detected by targeted LC-MS-MS. The relative spectrum count is normalized by the count at the EP* stall site (red) where tmRNA tagging was expected to occur in both the wild-type and ΔsmrB strains. The spectrum count corresponds to the mean and the standard deviation of three replicates. The arrow indicates the SmrB cleavage site demonstrated by 5’-RACE. d, 5’-RACE data on the Short SecM reporter reveal the SmrB cleavage sites as in Fig. 2b, zoomed in to show smaller peaks upstream. e, The distribution of FLAG-SmrB in cells treated with 5, 50, or 500 μg/mL erythromycin (ERY) was determined by fractionation over a sucrose gradient and detected with an anti-FLAG antibody.
Extended Data Fig. 5:
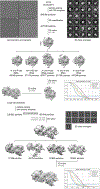
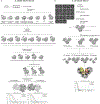
Cryo-EM data processing for the E. coli disome sample. Shown are the classification scheme, representative micrographs (the scale bar is 500 Å), 2D class averages and the Gold standard Fourier Shell Correlation (GSFSC) curve for the volume containing the 70S stalled ribosome and the 30S of the collided ribosome, as well as the full disome.
Extended Data Fig. 6:
Analysis of the E. coli disome structure and comparison of different disome structures. a, The architecture of the E. coli disome is not compatible with bS1 remaining bound to the stalled ribosome. Aligned models of the 30S subunits of the collided (left) and the stalled (middle) ribosomes are shown in surface representation. The position of bS1 as observed in the collided ribosome is shown in purple and the same position of bS1 in the stalled ribosome is indicated by a dashed line. The clash between bS1 of the stalled ribosome and the 30S subunit of the collided ribosome that would occur upon disome formation is shown on the right. b, Cartoon representation of the individual interactions as they occur at the E. coli disome interface. c, 2D class averages and cryo-EM structure model of an E. coli trisome. d&e, Comparison of the E. coli (E.c.) and B. subtilis (B.s.) disomes displaying full and cut views. Note the smaller space between stalled and collided ribosomes in the B.s. disome interface as illustrated by comparing the positions of uS2 proteins in the zoomed view in c. f, Surface representation of the structural model of the S. cerevisiae disome. g&h, Surface representation of the E. coli and B. subtilis hibernation disomes.
Extended Data Fig. 7:
Cryo-EM data processing for the B. subtilis disome and E. coli trisome sample. a, Shown are the classification scheme, and the Gold standard Fourier Shell Correlation (GSFSC) curves for the final volumes of the B. subtilis disome containing the 70S stalled ribosome and the 70S of the collided ribosome. b, Shown are the 2D class averages, classification scheme, and the Gold standard Fourier Shell Correlation (GSFSC) of the E. coli trisome.
Extended Data Fig. 8:
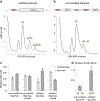
Production of collided and non-collided disomes and relative peak areas of monosomes and disomes in the SmrB nuclease assay. a, mRNA construct to create the collided E. coli disomes and trisomes and below the sucrose density gradient after in vitro translation. The ribosome stalling site is indicated by an asterisk. b, mRNA construct to create the non-collided disomes that were used in the nuclease assay and below the sucrose density gradient after in vitro translation. c, Relative monosome and disome peak area calculated from the sucrose gradient profiles of the SmrB nuclease assay, showing the mean and standard deviation of three replicates. d, The relative decrease of the area of the disome peak upon addition of SmrB is shown as the mean and standard deviation of three replicates. (The mean difference of the relative disome peak area of collided ribosomes between control and SmrB reaction was set to 1).
Extended Data Fig. 9:
Cryo-EM data processing for the E. coli disome sample. Shown are the classification scheme, representative micrographs (the scale bar is 500 Å), 2D class averages and the Gold standard Fourier Shell Correlation (GSFSC) curve for the respective 3D reconstructions. The segmented density for SmrB is colored according to local resolution.
Extended Data Fig. 10:
Structural model of SmrB. a, Secondary structure of SmrB. The DLH to ALA mutation is indicated. b, AF2 prediction models 1–5 as predicted through the API from the Söding lab. The SMR domain is predicted with high confidence, while the linker to the N-terminal helix appears flexible. c, AF2 prediction of the interaction between SmrB and uS2. For this prediction uS2 was fused to the C-terminus of SmrB with a glycine serine linker (39 copies of GS). The prediction shows the N-terminal helix of SmrB folded back onto uS2. d, Adjustment of the AF2 predicted model of SmrB-uS2. Without adjustment according to the cryo-EM density (as shown in D) the SMR domain would clash with the ribosome. e, Top: Cryo-EM density and adjusted model of the SmrB. Middle: Cryo-EM density and rigid body docked model of the N-terminus of SmrB from the collided 30S onto the stalled 30S. A second copy of SmrB was found anchored to uS2 of the stalled ribosome. However, there was no density for the SMR domain of the second SmrB, indicating a high degree of flexibility due to the lack of another ribosome in front of the stalled one. Bottom: in the control disome without SmrB, there is no density for the N-terminus of SmrB. f, Comparison of the AF2 prediction, the homology model, and the adjusted model of SmrB. Compared to the AF2 prediction, the homology model is missing the two N-terminal helices and most of the loops are slightly different (top). The AF2 prediction almost perfectly matched the cryo-EM density map and the corresponding adjusted model (middle and bottom). Only the catalytic loop (carrying the active site mutations) had to be slightly adjusted to prevent clashes with the mRNA. The N-terminus was adjusted as discussed above. g. During the preparation of this manuscript the AF2 prediction for SmrB (YfcN) became available at the alphafold database at EMBL-EBI. The deposited model resembles our final adjusted model very well including the position of the N-terminus. The confidence of the prediction (pLDDT) is indicated.
Extended Data Fig. 11:
Testing the importance of structural interactions for SmrB activity. a, Examples of operons containing both uS21 and SMR-domain proteins. b, The distribution of FLAG-tagged full-length SmrB and a construct with only the SMR domain (residues 88–183) was determined by fractionation over sucrose gradient and detection with an anti-FLAG antibody. A non-specific band is marked with *. c, Northern blots using the 3’-probe against the CRP reporters with the short SecM stalling motif in wild-type cells, bL9-deletion strain (ΔrplI), and a strain where mCherry is fused to the C-terminus of bL9 (bL9-mCherry). Ethidium bromide staining of 16S rRNA serves as a loading control. d, Northern blots using the 3’-probe against the CRP reporters with the short SecM stalling motif in wild-type cells, a strain where MBP is fused to the N-terminus of uS21, and a strain where GFP is fused to the C-terminus of uS6.
Figure 1.
Figure 1.
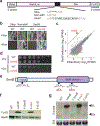
SmrB is a ribosome rescue factor. a, Between NanoLuc and the bleomycin resistance gene, we inserted stop codons, no added sequence, or the SecM stalling motif (black). b, Sections of plates with or without 50 μg/mL phleomycin showing growth of wild-type and ΔsmrB strains with reporters. c, The results of Tn-seq showing the number of transposon insertions for each gene (rpkm). d, Serial dilutions of wild-type and ΔsmrB cultures on plates with and without 200 μg/mL erythromycin. e, Domain organization of E. coli SmrB. Mutations at the conserved DxH and GxG motifs are indicated. f, Full-length SecM reporter protein was detected with anti-FLAG antibodies. Loading control = RpoB. F-SmrB, F-ALA, and F-GAG represent endogenously FLAG-tagged SmrB (not shown). g, SecM reporter mRNA was detected using a 3’-probe. Loading control = 23S rRNA. FL = full-length and Dn = downstream mRNA fragment.
Figure 2.
Figure 2.
SmrB cleavage at the 5’ boundary of stalled ribosomes promotes ribosome rescue. a, Northern blots of reporter mRNA using the 5’-probe and the 3’-probe show full-length (FL) or truncated RNAs (upstream or downstream fragments). Loading control = 23S rRNA. b, 5’-RACE reveals the 5’-ends of downstream fragments in reads per million on the SecM reporter. The first nt in the A-site codon in the stall motif is 0. c, 3’-RACE reveals the 3’-ends of upstream fragments. d, tmRNA tagging sites on the Short SecM reporter in the wild-type and ΔsmrB strains were detected by targeted LC-MS-MS. The relative spectrum count is normalized by the count at the SecM stall site (red). The mean and standard deviation of three replicates is shown. The arrow indicates the SmrB cleavage site. e, A model for mRNA processing during ribosome rescue.
Figure 3.
Figure 3.
SmrB acts on collided ribosomes. a, The distribution of FLAG-SmrB in a sucrose gradient was observed with anti-FLAG antibodies in samples with and without mupirocin treatment (to induce pauses at Ile codons). A non-specific band is marked with *. b, The distribution of FLAG-SmrB in lysates treated with RNase A. c, Samples treated with four different tetracycline concentrations were analyzed as in a. d, Various lengths of the crp gene were fused to ble with the short SecM motif between them. N represents the number of nucleotides between the start codon and stall site. Reporter mRNA was detected using the 3’-probe. An arrow indicates the downstream fragment. Loading control = 16S rRNA.
Figure 4.
Figure 4.
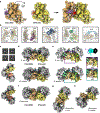
Cryo-EM structure of the E. coli disome. a, Cryo-EM density map of the E. coli disome with 50S subunits in grey, 30S subunits of the stalled and collided ribosome in yellow and orange, respectively, tRNAs in green, bS1 in purple, and bL9 in blue. b, Structural model of the E. coli disome. The bL9 proteins from stalled (bL9S) and collided (bL9C) ribosomes adopt different conformations. c, Interactions at the disome interface (opened up by rotation of the stalled and collided ribosomes); interacting partners are shown in matching colors.
Figure 5.
Figure 5.
Cryo-EM structure of the SmrB-bound E. coli disome. a, Disome nuclease assay. Sucrose gradients showing VemP-stalled disomes alone (ctrl) and incubated with wild-type (SmrB) or nuclease- deficient SmrB (mutant). Y-axes are A260 nm. b, Sucrose gradients showing collided disomes (left) and non-collided disomes (right) alone and with SmrB. Y-axes are A260 nm. c, Cryo-EM density map of the SmrB-bound E. coli disome with SmrB in pink. d, Zoomed view of the disome interface comparing the SmrB bound (left) and unbound (right) maps. e, Isolated cryo-EM density with the fitted SmrB model. f, Structural model of SmrB bound to the E. coli disome. g, Interactions between SmrB and the stalled and collided ribosomes. The disome interface is opened up by rotation of the stalled and collided ribosomes. h & i, Interactions of SmrB with the collided ribosome (h) and the stalled ribosome (i). The orientations with respect to g are indicated. j, Cut view of the SmrB-bound disome showing the mRNA path. k, Interaction of SmrB with the mRNA. The orientation in the upper part of k corresponds to j. Approximately 8 nucleotides of the mRNA are exposed at the disome interface, in reach for SmrB cleavage. The nucleotides at the ribosome boundaries are indicated; the first nucleotide in the A site of the stalled ribosome is 0.

Comment in

Similar articles

Cited by

References

    1. Müller C, Crowe-McAuliffe C & Wilson DN Ribosome Rescue Pathways in Bacteria. Front. Microbiol. 12, 652980 (2021). - PMC - PubMed
    1. Keiler KC, Waller PR & Sauer RT Role of a peptide tagging system in degradation of proteins synthesized from damaged messenger RNA. Science 271, 990–993 (1996). - PubMed
    1. Ivanova N, Pavlov MY, Felden B & Ehrenberg M Ribosome rescue by tmRNA requires truncated mRNAs. J. Mol. Biol. 338, 33–41 (2004). - PubMed
    1. Hayes CS & Sauer RT Cleavage of the A site mRNA codon during ribosome pausing provides a mechanism for translational quality control. Mol. Cell 12, 903–911 (2003). - PubMed
    1. Subramaniam AR, Zid BM & O’Shea EK An integrated approach reveals regulatory controls on bacterial translation elongation. Cell 159, 1200–1211 (2014). - PMC - PubMed

Publication types