Microbial Community Succession and Nutrient Cycling Responses following Perturbations of Experimental Saltwater Aquaria
- PMID: 30787117
- PMCID: PMC6382968
- DOI: 10.1128/mSphere.00043-19
Microbial Community Succession and Nutrient Cycling Responses following Perturbations of Experimental Saltwater Aquaria
Abstract
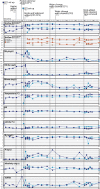
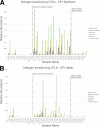
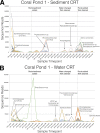
Although aquaria are common features of homes and other buildings, little is known about how environmental perturbations (i.e., tank cleaning, water changes, addition of habitat features) impact the diversity and succession of aquarium microbial communities. In this study, we sought to evaluate the hypotheses that newly established aquaria show clear microbial successional patterns over time and that common marine aquarium-conditioning practices, such as the addition of ocean-derived "live rocks" (defined as any "dead coral skeleton covered with crustose coralline algae" transferred into an aquarium from open ocean habitats) impact the diversity of microbial populations as well as nitrogen cycling in aquaria. We collected water chemistry data alongside water and sediment samples from two independent and newly established saltwater aquaria over a 3-month period. Microbial communities in samples were assessed by DNA extraction, amplification of the 16S rRNA gene, and Illumina MiSeq sequencing. Our results showed clear and replicable patterns of community succession in both aquaria, with the existence of multiple stable states for aquarium microbial assemblages. Notably, our results show that changes in aquarium microbial communities do not always correlate with water chemistry measurements and that operational taxonomic unit (OTU)-level patterns relevant to nitrogen cycling were not reported as statistically significant. Overall, our results demonstrate that aquarium perturbations have a substantial impact on microbial community profiles of aquarium water and sediment and that the addition of live rocks improves nutrient cycling by shifting aquarium communities toward a more typical saltwater assemblage of microbial taxa.IMPORTANCE Saltwater aquaria are living systems that support a complex biological community of fish, invertebrates, and microbes. The health and maintenance of saltwater tanks are pressing concerns for home hobbyists, zoos, and professionals in the aquarium trade; however, we do not yet understand the underlying microbial species interactions and community dynamics which contribute to tank setup and conditioning. This report provides a detailed view of ecological succession and changes in microbial community assemblages in two saltwater aquaria which were sampled over a 3-month period, from initial tank setup and conditioning with "live rocks" through subsequent tank cleanings and water replacement. Our results showed that microbial succession appeared to be consistent and replicable across both aquaria. However, changes in microbial communities did not always correlate with water chemistry measurements, and aquarium microbial communities appear to have shifted among multiple stable states without any obvious buildup of undesirable nitrogen compounds in the tank environment.
Keywords: 16S rRNA gene; bacteria; community succession; metabarcoding; saltwater aquarium; water chemistry.
Copyright © 2019 Bik et al.
Figures


Similar articles
-
Broad Phylogenetic Diversity Associated with Nitrogen Loss through Sulfur Oxidation in a Large Public Marine Aquarium.Appl Environ Microbiol. 2018 Oct 1;84(20):e01250-18. doi: 10.1128/AEM.01250-18. Print 2018 Oct 15. Appl Environ Microbiol. 2018. PMID: 30097447 Free PMC article.
-
Changes in northern Gulf of Mexico sediment bacterial and archaeal communities exposed to hypoxia.Geobiology. 2015 Sep;13(5):478-93. doi: 10.1111/gbi.12142. Epub 2015 May 5. Geobiology. 2015. PMID: 25939270
-
Nematode-associated microbial taxa do not correlate with host phylogeny, geographic region or feeding morphology in marine sediment habitats.Mol Ecol. 2018 Apr;27(8):1930-1951. doi: 10.1111/mec.14539. Epub 2018 Mar 29. Mol Ecol. 2018. PMID: 29600535
-
The Rare Biosphere: This report is based on a colloquium convened by the American Academy of Microbiology on April 27–29, 2009 in San Francisco, CA.Washington (DC): American Society for Microbiology; 2011. Washington (DC): American Society for Microbiology; 2011. PMID: 32809309 Free Books & Documents. Review.
-
Solar salterns as model systems to study the units of bacterial diversity that matter for ecosystem functioning.Curr Opin Biotechnol. 2022 Feb;73:151-157. doi: 10.1016/j.copbio.2021.07.028. Epub 2021 Aug 23. Curr Opin Biotechnol. 2022. PMID: 34438234 Review.
Cited by
-
Unique bacterial communities associated with components of an artificial aquarium ecosystem and their possible contributions to nutrient cycling in this microecosystem.World J Microbiol Biotechnol. 2022 Mar 12;38(4):72. doi: 10.1007/s11274-022-03258-9. World J Microbiol Biotechnol. 2022. PMID: 35277761
-
Reconstruction of Metagenome-Assembled Genomes from Aquaria.Microbiol Resour Announc. 2021 Aug 5;10(31):e0055721. doi: 10.1128/MRA.00557-21. Epub 2021 Aug 5. Microbiol Resour Announc. 2021. PMID: 34351234 Free PMC article.
-
Ecological drivers switch from bottom-up to top-down during model microbial community successions.ISME J. 2021 Apr;15(4):1085-1097. doi: 10.1038/s41396-020-00833-6. Epub 2020 Nov 23. ISME J. 2021. PMID: 33230267 Free PMC article.
-
Effects of feeding on the physiological performance of the stony coral Pocillopora acuta.Sci Rep. 2020 Nov 17;10(1):19988. doi: 10.1038/s41598-020-76451-1. Sci Rep. 2020. PMID: 33203892 Free PMC article.
-
Culture systems influence the physiological performance of the soft coral Sarcophyton glaucum.Sci Rep. 2020 Nov 19;10(1):20200. doi: 10.1038/s41598-020-77071-5. Sci Rep. 2020. PMID: 33214591 Free PMC article.

