. 2017 Apr 10:8:14929.
doi: 10.1038/ncomms14929.

Structural insights into POT1-TPP1 interaction and POT1 C-terminal mutations in human cancer

Affiliations

Structural insights into POT1-TPP1 interaction and POT1 C-terminal mutations in human cancer

Cong Chen et al. Nat Commun. .

Abstract

Mammalian shelterin proteins POT1 and TPP1 form a stable heterodimer that protects chromosome ends and regulates telomerase-mediated telomere extension. However, how POT1 interacts with TPP1 remains unknown. Here we present the crystal structure of the C-terminal portion of human POT1 (POT1C) complexed with the POT1-binding motif of TPP1. The structure shows that POT1C contains two domains, a third OB fold and a Holliday junction resolvase-like domain. Both domains are essential for binding to TPP1. Notably, unlike the heart-shaped structure of ciliated protozoan Oxytricha nova TEBPα-β complex, POT1-TPP1 adopts an elongated V-shaped conformation. In addition, we identify several missense mutations in human cancers that disrupt the POT1C-TPP1 interaction, resulting in POT1 instability. POT1C mutants that bind TPP1 localize to telomeres but fail to repress a DNA damage response and inappropriate repair by A-NHEJ. Our results reveal that POT1 C terminus is essential to prevent initiation of genome instability permissive for tumorigenesis.


Conflict of interest statement

The authors declare no competing financial interests.

Figures
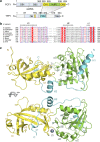
Figure 1
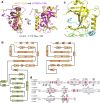
Figure 1. The POT1C–TPP1PBM complex structure.
(a) Domain organization of the POT1–TPP1 complex. OB1 and OB2 of POT1, the OB fold and the TBM (TIN2-binding motif) of TPP1 are coloured in light blue. The C-terminal OB3 and the embedded HJRL domain are coloured in yellow and green, respectively. The PBM of TPP1 is in cyan. The TEL patch in TPP1OB is coloured in orange. The shaded area indicates the interaction between POT1 and TPP1. (b) Structural-based sequence alignment of the PBM of human TPP1 and its homologues. The secondary structures (H, α-helix; η, 310-helix) of human TPP1 are labelled on the top. Homo sapiens, NP_001075955.1; Pan troglodytes, XP_003315229.1; Canis lupus, XP_853906.2; Mus musculus, NP_001012656.1; Rattus norvegicus, NP_001032270.1; Gallus gallus, XP_004944139.1; Xenopus laevis, NP_001089068.1; Xenopus tropicalis, NP_001120423.1; Danio rerio, NP_001124265.1. (c) Ribbon diagram of two orthogonal views of the POT1C–TPP1PBM complex. POT1OB3 is coloured in yellow, POT1HJRL in green and TPP1PBM in cyan.
Figure 2
Figure 2. Structural conservation of POT1OB3 and TEBPαOB3.
(a) Superposition of human POT1OB3 and O. nova TEBPαOB3. POT1OB3 is coloured in yellow and TEBPαOB3 in magenta. The r.m.s.d. value and the number of residues used for superposition are listed. (b) Comparison of the topology diagram of C terminus of POT1 and TEBPα. (c) Similar to O. nova TEBPαOB3, POT1OB3 utilizes the canonical ssDNA-binding groove to bind a short 310-helix η1 of TPP1PBM. (d) Sequence alignment of POT1OB3 and TEBPαOB3. Secondary structures (α, α-helix; β, β-strand; η, 310-helix) of human POT1OB3 and O. nova TEBPαOB3 are labelled on the top and bottom of the sequences, respectively.
Figure 3
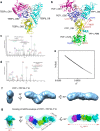
Figure 3. XL-MS and SAXS analyses indicate that the overall architecture of the POT1–TPP1–ssDNA complex is different from that of the TEBPα–β–ssDNA complex.
(a) Ribbon diagram of the heart-shaped TEBPα–β–ssDNA complex. (b) Superposition of the crystal structure of human TPP1OB, POT1OB3-HJRL–TPP1PBM and POT1OB1-OB2–ssDNA onto the structure of the O. nova TEBPα–β–ssDNA complex. The dotted line indicates the distance between the end of TPP1OB (His241) and the beginning of TPP1PBM (Gly264). Crosslinked residues of POT1 and TPP1 are denoted by red and blue dots, respectively. (c) Annotated high-scoring spectrum of the crosslinked POT1–TPP1N complex unambiguously identified the crosslinked peptide sequences as KVAVHFVK of POT1 and VPGCNQDLVQKK of TPP1, respectively, demonstrating an intermolecular linkage between POT1Lys433 and TPP1Lys232. (d) Annotated high-scoring spectrum of the crosslinked POT1–TPP1N complex unambiguously identified the crosslinked peptide sequences as SLKVGSFLR and SYKPR of POT1, respectively, demonstrating an intramolecular linkage between residues Lys234 and Lys370 of POT1. (e) Guinier plot of the POT1–TPP1N–T10 complex indicating that the complex is monodisperse and homogeneous in solution. (f) Three views of the V-shaped envelop of the POT1–TPP1N–T10 complex. The envelope is coloured in light blue. (g) Docking of the crystal structures of human TPP1OB, POT1OB3-HJRL–TPP1PBM and POT1OB1-OB2–ssDNA into the envelope of POT1–TPP1N–T10 complex. POT1 OB1, OB2, OB3, and HJRL and TPP1 are coloured in magenta, blue, yellow, green and cyan, respectively. Envelope of the POT1–TPP1N–T10 complex is coloured in light blue.
Figure 4
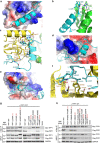
Figure 4. Structural and mutational analyses of the POT1C–TPP1PBM interaction.
(a,d,e) The electrostatic surface potential of the three TPP1PBM-binding modules on POT1C (positive potential, blue; negative potential, red). TPP1PBM is in ribbon representation and coloured in cyan. (b,c,f) The intermolecular interactions at the three TPP1PBM-binding modules interface. The colour scheme is the same as in Fig. 1c. Residues important for the interaction are shown as stick models. Salt bridges and hydrogen-bonding interaction are shown as magenta dashed lines. (g) Co-IP of POT1 with co-transfected WT and mutations of TPP1 that interfere with one or two POT1–TPP1-binding modules. The levels of each protein in the input and IP samples were analysed by immunoblotting with the indicated antibodies. ‘Input' contains 5% of the input whole cell lysate used for IPs. (h) Co-IP of TPP1 with co-transfected WT and mutations of POT1 that interfere with one or two POT1–TPP1-binding modules.
Figure 5
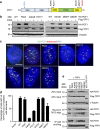
Figure 5. Characterization of POT1 C-terminal mutants.
(a) POT1C mutations identified in human cancers. The N-terminal OB1 mutation F62A is coloured blue, while POT1C mutations found in TNBC and FM are coloured black and red, respectively. (b) Co-expression of WT and mutant HA–POT1 with or without Flag-TPP1 in 293T cells. γ-tubulin served as a loading control. (c) Telomere co-localization of WT and mutant HA–POT1 in U2OS cells. Cells were immunostained with anti-HA (green), hybridized with Cy5-(CCCTAA)4 probe (red) to detect telomeres and stained with DAPI (blue) for nuclei. Arrows point to HA–POT1 foci at telomeres. Scale bar, 5 μm. (d) Quantification of c to illustrate percentage of cells with more than five HA–POT1 foci co-localized with telomeres. Error bar (s.e.m.) was derived from three repeated experiments. A minimum of 250 nuclei were scored per experiment and three independent experiments were performed. (e) DNA binding and co-IP assays to assess the impact of HA–POT1 mutations on binding to ss Tel-G (TTAGGG)6 oligonucleotides in the presence of Flag-TPP1. WT or mutant HA–POT1 proteins were co-expressed with either Flag-tagged WT TPP1 or TPP1ΔRD in 293T cells. Cell lysates were incubated with streptavidin beads bound by biotinylated ss Tel-G or anti-Flag conjugated agarose beads. Input represents 20% of lysate used for DNA binding or IP.
Figure 6
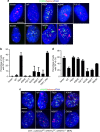
Figure 6. Some POT1C OB3 mutants cannot protect telomeres from engaging a DDR.
(a) Co-localization of γ-H2AX with telomeres in U2OS cells expressing WT or mutant HA–POT1. Cells were immunostained with anti-HA antibody to detect HA–POT1 (green), hybridized with Cy3-(CCCTAA)4 probe (red) to detect telomeres and DAPI (blue) for nuclei. Arrows point to a few TIFs. Scale bar, 5 μm. (b) Quantification of frequency of γ-H2AX-positive TIFs in a. Cells with ≥5 TIFs were scored as positive. TPP1ΔRD treatment to elicit TIF formation was used as a positive control. Error bar (s.e.m.) was derived from three repeated experiments. A minimum of 100 nuclei were scored per experiment and three independent experiments were performed. (c) Co-localization of γ-H2AX with telomeres in CAG-CreER; mPOT1aF/F, mPOT1b−/− MEFs reconstituted with the indicated DNA constructs and then treated with 4-HT. Cells were immunostained with anti-γ-H2AX antibody (green), hybridized with Cy3-(CCCTAA)4 probe to detect telomeres (red) and DAPI (blue) for nuclei. Arrows point to a few TIFs. Scale bar, 5 μm. (d) Quantification of percentage of γ-H2AX-positive TIFs in c. Cells with ≥5 TIFs were scored as positive. TPP1ΔRD treatment to elicit TIF formation was used as a positive control. Error bar (s.e.m.) was derived from three experiments with a minimum of 30 metaphases were scored per experiments.
Figure 7
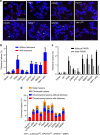
Figure 7. POT1 C-terminal mutations promote A-NHEJ-mediated repair.
(a) Chromosome fusions in IMR90 cells infected with WT POT1 or POT1 mutants. Metaphase spreads were analysed by peptide nucleic acid - fluorescence in situ hybridization (PNA-FISH). Arrowheads point to fusion sites with (red) or without (white) telomere signals. Scale bar, 25 μm. (b) Quantification of percentage of telomere fusions in a. A minimum of 30 metaphase data were scored per experiment. Error bar (s.e.m.) was derived from three independent experiments. (c) Quantification of the percentage of telomere fusions in immortalized IMR90 infected with WT POT1 or POT1 mutants in the presence or absence of the PARP inhibitor PJ34. A minimum of 100 nuclei were scored per experiment. Error bars represent the s.e.m. from three independent experiments. (d) Quantification of the percentage of telomere fusions in CAG-CreER; mPOT1aF/F, mPOT1b−/− MEFs reconstituted with the indicated DNA constructs and then treated with 4-HT. Error bars represent the s.e.m. from three independent experiments with a minimum of 30 metaphases scored per experiment.

Similar articles

Cited by

References

    1. Cech T. R. Beginning to understand the end of the chromosome. Cell 116, 273–279 (2004). - PubMed
    1. Makarov V. L., Hirose Y. & Langmore J. P. Long G tails at both ends of human chromosomes suggest a C strand degradation mechanism for telomere shortening. Cell 88, 657–666 (1997). - PubMed
    1. Wright W. E., Tesmer V. M., Huffman K. E., Levene S. D. & Shay J. W. Normal human chromosomes have long G-rich telomeric overhangs at one end. Genes Dev. 11, 2801–2809 (1997). - PMC - PubMed
    1. Baumann P. & Cech T. R. Pot1, the putative telomere end-binding protein in fission yeast and humans. Science 292, 1171–1175 (2001). - PubMed
    1. de Lange T. Shelterin: the protein complex that shapes and safeguards human telomeres. Genes Dev. 19, 2100–2110 (2005). - PubMed

Publication types

MeSH terms