Aggregate-based sub-CMC Solubilization of n-Alkanes by Monorhamnolipid Biosurfactant
- PMID: 27547030
- PMCID: PMC4988678
- DOI: 10.1039/C5NJ02108A
Aggregate-based sub-CMC Solubilization of n-Alkanes by Monorhamnolipid Biosurfactant
Abstract
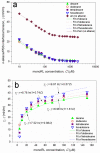
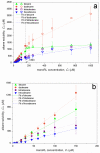
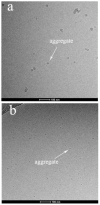
Solubilization of n-decane, dodecane, tetradecane and hexadecane by monorhamnolipid biosurfactant (monoRL) at concentrations near the critical micelle concentration (CMC) was investigated. The apparent solubility of all the four alkanes increases linearly with increasing monoRL concentration either below or above CMC. The capacity of solubilization presented by the molar solubilization ratio (MSR), however, is stronger at monoRL concentrations below CMC than above CMC. The MSR decreases following the order dodecane > decane > tetradecane > hexadecane at monoRL concentration below CMC. Formation of aggregates at sub-CMC monoRL concentrations was demonstrated by dynamic light scattering (DLS) and cryo-transmission electron microscopy examination. DLS-based size (d) and zeta potential of the aggregates decrease with increasing monoRL concentration. The surface excess (Γ) of monoRL calculated based on alkane solubility and aggregate size data increases rapidly with increasing bulk monoRL concentration, and then asymptotically approaches the maximum surface excess (Γmax). Relation between Γ and d indicates that the excess of monoRL molecules at the aggregate surface greatly impacts the surface curvature. The results demonstrate formation of aggregates for alkane solubilization at monoRL concentrations below CMC, indicating the potential of employing low-concentration rhamnolipid for enhanced solubilization of hydrophobic organic compounds.
Keywords: aggregation; biosurfactant; critical micelle concentration; monorhamnolipid; n-alkane; solubilization.
Figures


Similar articles
-
Sub-CMC solubilization of dodecane by rhamnolipid in saturated porous media.Sci Rep. 2016 Sep 13;6:33266. doi: 10.1038/srep33266. Sci Rep. 2016. PMID: 27619361 Free PMC article.
-
Sub-CMC solubilization of n-alkanes by rhamnolipid biosurfactant: the Influence of rhamnolipid molecular structure.Colloids Surf B Biointerfaces. 2020 Apr 18;192:111049. doi: 10.1016/j.colsurfb.2020.111049. Online ahead of print. Colloids Surf B Biointerfaces. 2020. PMID: 32353711
-
Aggregate-based sub-CMC Solubilization of Hexadecane by Surfactants.RSC Adv. 2015;5(95):78142-78149. doi: 10.1039/C5RA12388G. Epub 2015 Sep 4. RSC Adv. 2015. PMID: 26925230 Free PMC article.
-
Physicochemical characterization of a monorhamnolipid secreted by Pseudomonas aeruginosa MA01 in aqueous media. An experimental and molecular dynamics study.Colloids Surf B Biointerfaces. 2013 Jan 1;101:256-65. doi: 10.1016/j.colsurfb.2012.06.035. Epub 2012 Jul 6. Colloids Surf B Biointerfaces. 2013. PMID: 23010028
-
Solubilization of Hydrophobic Dyes in Surfactant Solutions.Materials (Basel). 2013 Feb 21;6(2):580-608. doi: 10.3390/ma6020580. Materials (Basel). 2013. PMID: 28809328 Free PMC article. Review.
Cited by
-
Microbial Surfactants: The Next Generation Multifunctional Biomolecules for Applications in the Petroleum Industry and Its Associated Environmental Remediation.Microorganisms. 2019 Nov 19;7(11):581. doi: 10.3390/microorganisms7110581. Microorganisms. 2019. PMID: 31752381 Free PMC article. Review.
-
Sub-CMC solubilization of dodecane by rhamnolipid in saturated porous media.Sci Rep. 2016 Sep 13;6:33266. doi: 10.1038/srep33266. Sci Rep. 2016. PMID: 27619361 Free PMC article.
-
Surfactant-enhanced biodegradation of crude oil by mixed bacterial consortium in contaminated soil.Environ Sci Pollut Res Int. 2018 May;25(15):14437-14446. doi: 10.1007/s11356-018-1604-3. Epub 2018 Mar 10. Environ Sci Pollut Res Int. 2018. PMID: 29525865
-
Towards Rational Biosurfactant Design-Predicting Solubilization in Rhamnolipid Solutions.Molecules. 2021 Jan 20;26(3):534. doi: 10.3390/molecules26030534. Molecules. 2021. PMID: 33498574 Free PMC article.
-
Contribution of Nonaqueous-Phase Liquids to the Retention and Transport of Per and Polyfluoroalkyl Substances (PFAS) in Porous Media.Environ Sci Technol. 2021 Mar 16;55(6):3706-3715. doi: 10.1021/acs.est.0c07355. Epub 2021 Mar 5. Environ Sci Technol. 2021. PMID: 33666425 Free PMC article.
References
-
- Fu HY, Zeng GM, Zhong H, Yuan XZ, Huang GH. Biodegradation. 2007;18:303–310. - PubMed
-
- Liu XL, Zeng GM, Tang L, Zhong H, Wang RY, Fu HY, Liu ZF, Huang HL, Zhang JC. Process Biochem. 2008;43:1300–1303.
-
- Zhong H, Liu Y, Liu ZF, Jiang YB, Tan F, Zeng GM, Yuan XZ, Yan M, Niu QY, Liang YS. Int. Biodeter. Biodegr. 2014;94:152–159.
-
- Banat IM, Franzetti A, Gandolfi I, Bestetti G, Martinotti MG, Fracchia L, Smyth TJ, Marchant R. Appl. Microbiol. Biotechnol. 2010;87:427–444. - PubMed
-
- Abriola LM, Drummond CD, Hahn EJ, Hayes KF, Kibbey TCG, Lemke LD, Pennell KD, Petrovskis EA, Ramsburg CA, Rathfelder KM. Environ. Sci. Technol. 2005;39:1778–1790. - PubMed
Grants and funding
LinkOut - more resources
Full Text Sources
Other Literature Sources
