. 2015 Oct 12;28(4):486-499.
doi: 10.1016/j.ccell.2015.09.001. Epub 2015 Sep 24.

hnRNP K Is a Haploinsufficient Tumor Suppressor that Regulates Proliferation and Differentiation Programs in Hematologic Malignancies

Affiliations

hnRNP K Is a Haploinsufficient Tumor Suppressor that Regulates Proliferation and Differentiation Programs in Hematologic Malignancies

Miguel Gallardo et al. Cancer Cell. .

Abstract

hnRNP K regulates cellular programs, and changes in its expression and mutational status have been implicated in neoplastic malignancies. To directly examine its role in tumorigenesis, we generated a mouse model harboring an Hnrnpk knockout allele (Hnrnpk(+/-)). Hnrnpk haploinsufficiency resulted in reduced survival, increased tumor formation, genomic instability, and the development of transplantable hematopoietic neoplasms with myeloproliferation. Reduced hnRNP K expression attenuated p21 activation, downregulated C/EBP levels, and activated STAT3 signaling. Additionally, analysis of samples from primary acute myeloid leukemia patients harboring a partial deletion of chromosome 9 revealed a significant decrease in HNRNPK expression. Together, these data implicate hnRNP K in the development of hematological disorders and suggest hnRNP K acts as a tumor suppressor.


Conflict of interest statement

Conflicts of interests: The authors declare no conflicts.

Figures

Figure 1
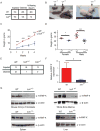
Figure 1. HNRNPK expression is reduced in patients with AML that harbor a 9q deletion
Quantitative RT-PCR analysis of HNRNPK levels from bone marrow aspirates of AML patients who carry 9q deletions (n = 12) and healthy donors controls (n = 8) (p = 0.0001). Data are represented as mean ± SEM determined from triplicate samples after normalization to geometric mean of β-ACTIN and GAPDH. ***p < 0.005. P-values were calculated using the Mann-Whitney test.
Figure 2
Figure 2. Generation of Hnrnpk haploinsufficient mice
(A) Schema of the Hnrnpk locus and the KOMP targeting vector (Hnrnpk1(KOMP)Wtsi). The targeting vector replaced exons 3 through 6 and with a neomycin selectable marker flanked by LoxP sites (ovals) and LacZ cassette flanked by Flp sites (arrowheads). Black numbered boxes denote Hnrnpk exons. (B) PCR analysis of targeted recombination in Hnrnpk+/− mice. The 5.9-kb amplicon (dark blue arrow heads) represents the recombined Hnrnpk allele using external and internal primers for the 5′ arm. Wild-type DNA serves as a negative control. The 10.1-kb (black arrow heads), 9.1-kb (red arrow heads), 8.1-kb (green arrow heads), and 5.5-kb (light blue arrow heads) amplicons represent the recombined Hnrnpk allele using external and internal primers for the 3′ arm. See also: Figure S1.
Figure 3
Figure 3. Hnrnpk+/− mice have developmental defects and reduced hnRNP K expression
(A) Observed and expected number of Hnrnpk+/− and wild type mice at weaning (21 days). (B) Growth retardation in Hnrnpk+/− mice at day 3 (Left panel) and 10 days (Right panel). (C) Weight (in grams) of Hnrnpk+/− (n = 10) and wild type littermates (n = 8) over the first four weeks of life (p = 0.0001). (D) Weight analysis (in grams) of adult Hnrnpk+/− and wild type mice stratified by sex (Female, p = 0.011) and (Male, p = 0.003). (E) Observed and expected ratio of Hnrnpk−/−, Hnrnpk+/−, and wild type mice from 12 separate hnRNP K+/− matings at weaning (21 days). (F) Quantitative RT-PCR analysis of Hnrnpk expression in the bone marrow of wild type (n = 4) and Hnrnpk+/− (n = 4) mice (p = 0.0396). (G) Western blot analyses of hnRNP K levels in lysates from wild type and Hnrnpk+/− mice, (upper-left panel: MEFs; upper-right panel: whole bone marrow; bottom-left panel: spleen; bottom-right panel: liver). Data are represented as mean ± SEM. *p < 0.05 and ***p < 0.005. p-values were calculated using Mann-Whitney test.
Figure 4
Figure 4. Reduced hnRNP K expression results in increased proliferation and a dampened p21 response following DNA damage
(A) Increased cell proliferation in Hnrnpk+/− MEFs. Three low passage (P2) MEF cell lines per genotype were plated for 24, 48 or 72 hr, and then assayed by WST-8 (p = 0.0070). Each data point represents the mean ± SEM for three separate MEF lines per genotype (B) Quantitative RT-PCR analysis of p21 levels before and after irradiation from WT and Hnrnpk+/− MEFs. (C) Western blot analysis of hnRNP K and p21 expression in lysates from γ-IR treated wild type and Hnrnpk+/− MEFs. β-actin serves as an internal control. Data are represented as mean ± SEM. ***p < 0.005. P-values were calculated using unpaired t-tests and Mann-Whitney tests. See also, Figure S2.
Figure 5
Figure 5. Hnrnpk+/− mice develop myeloid hyperplasia
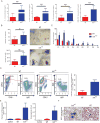
(A) Cell blood count (CBC) of peripheral blood comparing neutrophils (p = 0.0006) and basophils (p = 0.0477) from wild type (n = 8) and Hnrnpk+/− (n = 11) mice and platelets (p = 0.0095) of wild type (n = 6) and hnRNP K+/− (n = 6) mice. (B) Flow cytometry analysis of double positive Ly6G/CD11b myeloid populations (50,000 gated cells) in the peripheral blood of wild type (n = 6) and hnRNP K+/− (n =6) (upper panel, p = 0.0354) and bone marrow of wild type (n = 7) and hnRNP K+/− (n = 13) (bottom panel, p = 0.0008) mice. Percentages were compared and analyzed using Mann-Whitney test. Data are represented as mean ± SEM. *p < 0.05, **p < 0.01, and ***p < 0.005. See also, Figure S3.
Figure 6
Figure 6. Hnrnpk+/− mice have reduced survival and are tumor prone
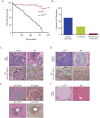
(A) Kaplan-Meier curves indicating survival of Hnrnpk+/− (n = 76) and wild type (n = 37) mice. Statistical significance was determined by log rank test (p = 0.0001). (B) Hnrnpk haploinsufficiency results in tumor phenotypes (n = 55; 62% myeloproliferation, 31% lymphoma and 4% hepatocellular carcinoma). (C) Hematoxylin and Eosin (H&E) staining of paraffin-embedded bone marrow sections and peripheral blood (PB) smears from wild type Hnrnpk+/− mice diagnosed with myeloid hyperplasias. The scale bar for H&E staining represents 50 μm and 25 μm for PB smears. (D) H&E staining of paraffin-embedded splenic sections and PB smears from wild type and lymphoma burdened Hnrnpk+/− mice. (E) H&E and immunohistochemical staining of malignant T-cell (CD3 positive, Bottom Panel) and B-cell (B220 positive, Top Panel) lymphomas in the liver of Hnrnpk+/− mice. (F) H&E staining of paraffin-embedded liver sections from wild type and Hnrnpk+/− mice diagnosed with hepatocellular carcinoma. See also Figure S4.
Figure 7
Figure 7. hnRNP K-mediated activation of cytokines contributes to proliferation and differentiation phenotypes
(A) Cytokines array analysis of IL-3, IL-6, G-CSF and GM-CSF levels in the peripheral blood of wild type (n = 10) and Hnrnpk+/− mice (n = 9) diagnosed with myeloid hyperplasia (IL-3: p = 0.0002, IL-6: p = 0.0004, G-CSF: p = 0.0002, and GM-CSF: p = 0.0002). (B) Analyses of colony formation assays after 14 days using Lin-CD117+ hematopoietic stem cells from wild type (n = 8) and Hnrnpk+/− (n = 17) mice (number of colonies: p = 0.0078 and number of cells: p = 0.0001). All experiments were performed in triplicate. Data are represented as mean ± SEM. **p < 0.01 and ***p < 0.005. P-values were calculated using Mann-Whitney test. (C) Replating analysis of Lin-CD117+ hematopoietic stem cells from wild type (n = 5) and Hnrnpk+/− (n = 7) mice. Each passage was analyzed every 14 days. All experiments were performed in quadruplicate. Data are represented as mean ± SEM. (D) Flow cytometry analysis of CD45.1+ (host) and CD45.2+ (donor) in the transplanted host mice and B220+ and Ly6G+ cells within the CD45.2+ population. (E) CBC analysis of untransplanted NSG (control) mice and NSG mice transplanted with wild type or Hnrnpk+/− HSCs. (F) Wright's staining of peripheral blood (PB) smears from NSG mice transplanted with wild type or Hnrnpk+/− HSCs harboring malignant lymphoid cells. See also, Figure S5.
Figure 8
Figure 8. Hnrnpk haploinsufficiency alters expression of genes controlling proliferation and differentiation
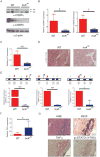
(A) Western blot analysis of C/EBPα and C/EBPβ from lysates of wild type and Hnrnpk+/− mice. Upper arrow denotes the p42 isoform of C/EBPα and the lower arrow marks the p30 isoform. β-actin serves as a loading control. (B) Quantitative RT-PCR analysis of C/EBPα and C/EBPβ levels from whole bone marrows of wild type (n = 8) and Hnrnpk+/− (n = 10) mice (C/EBPα: p = 0.042 and C/EBPβ: p = 0.020). (C) Quantitative RT-PCR analysis of p21 levels in wild type (n = 8) and Hnrnpk+/− (n = 10) bone marrows (p = 0.0044). (D) Immunohistochemical analysis of phos-Y705Stat3 levels in the bone marrow wild type and Hnrnpk+/− mice diagnosed with myeloid hyperplasia. The scale bar represents 50 μm. (E) ChIP analysis of hnRNP K interacting with the C/EBPα, C/EBPβ and p21 genes in wild type or Hnrnpk+/− tissues. Each rectangle represents the corresponding gene. The closed black box denoted the region harboring a putative hnRNP K binding sequence that is amplified by the corresponding primer sets. The “check-mark” denotes positive hnRNP K binding and the “X” denotes a lack of interaction. (F) Quantitative RT-PCR analysis of TNFα levels in spleens from wild type (n = 7) and tumor burdened Hnrnpk+/− (n = 5) mice (p = 0.0177). (G) H&E staining and immunohistochemical analyses of B220, TNFα, and phos-Y705STAT3 expression in Hnrnpk+/− mice with malignant lymphoid infiltration in the liver. Data are represented as mean ± SEM. *p < 0.05 and ***p < 0.005. P-values were calculated using unpaired t and Mann-Whitney tests. See also Figure S6.

Similar articles

Cited by

References

    1. Genomic and epigenomic landscapes of adult de novo acute myeloid leukemia. N Engl J Med. 2013;368:2059–2074. - PMC - PubMed
    1. Bochkis IM, Rubins NE, White P, Furth EE, Friedman JR, Kaestner KH. Hepatocyte-specific ablation of Foxa2 alters bile acid homeostasis and results in endoplasmic reticulum stress. Nat Med. 2008;14:828–836. - PMC - PubMed
    1. Burnett A, Wetzler M, Lowenberg B. Therapeutic advances in acute myeloid leukemia. J Clin Oncol. 2011;29:487–494. - PubMed
    1. Dayyani F, Wang J, Yeh JR, Ahn EY, Tobey E, Zhang DE, Bernstein ID, Peterson RT, Sweetser DA. Loss of TLE1 and TLE4 from the del(9q) commonly deleted region in AML cooperates with AML1-ETO to affect myeloid cell proliferation and survival. Blood. 2008;111:4338–4347. - PMC - PubMed
    1. Enge M, Bao W, Hedstrom E, Jackson SP, Moumen A, Selivanova G. MDM2-dependent downregulation of p21 and hnRNP K provides a switch between apoptosis and growth arrest induced by pharmacologically activated p53. Cancer Cell. 2009;15:171–183. - PubMed

Publication types

MeSH terms

Substances

LinkOut - more resources