Somatic activation of AKT3 causes hemispheric developmental brain malformations
- PMID: 22500628
- PMCID: PMC3460551
- DOI: 10.1016/j.neuron.2012.03.010
Somatic activation of AKT3 causes hemispheric developmental brain malformations
Abstract
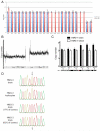
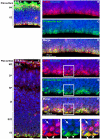
Hemimegalencephaly (HMG) is a developmental brain disorder characterized by an enlarged, malformed cerebral hemisphere, typically causing epilepsy that requires surgical resection. We studied resected HMG tissue to test whether the condition might reflect somatic mutations affecting genes critical to brain development. We found that two out of eight HMG samples showed trisomy of chromosome 1q, which encompasses many genes, including AKT3, a gene known to regulate brain size. A third case showed a known activating mutation in AKT3 (c.49G→A, creating p.E17K) that was not present in the patient's blood cells. Remarkably, the E17K mutation in AKT3 is exactly paralogous to E17K mutations in AKT1 and AKT2 recently discovered in somatic overgrowth syndromes. We show that AKT3 is the most abundant AKT paralog in the brain during neurogenesis and that phosphorylated AKT is abundant in cortical progenitor cells. Our data suggest that somatic mutations limited to the brain could represent an important cause of complex neurogenetic disease.
Copyright © 2012 Elsevier Inc. All rights reserved.
Figures


Similar articles
-
PI3K/AKT pathway mutations cause a spectrum of brain malformations from megalencephaly to focal cortical dysplasia.Brain. 2015 Jun;138(Pt 6):1613-28. doi: 10.1093/brain/awv045. Epub 2015 Feb 25. Brain. 2015. PMID: 25722288 Free PMC article.
-
Mutations of AKT3 are associated with a wide spectrum of developmental disorders including extreme megalencephaly.Brain. 2017 Oct 1;140(10):2610-2622. doi: 10.1093/brain/awx203. Brain. 2017. PMID: 28969385 Free PMC article.
-
De novo somatic mutations in components of the PI3K-AKT3-mTOR pathway cause hemimegalencephaly.Nat Genet. 2012 Jun 24;44(8):941-5. doi: 10.1038/ng.2329. Nat Genet. 2012. PMID: 22729223 Free PMC article.
-
Hemimegalencephaly, a paradigm for somatic postzygotic neurodevelopmental disorders.Curr Opin Neurol. 2013 Apr;26(2):122-7. doi: 10.1097/WCO.0b013e32835ef373. Curr Opin Neurol. 2013. PMID: 23449172 Review.
-
The role of somatic mutational events in the pathogenesis of epilepsy.Curr Opin Neurol. 2019 Apr;32(2):191-197. doi: 10.1097/WCO.0000000000000667. Curr Opin Neurol. 2019. PMID: 30762606 Free PMC article. Review.
Cited by
-
Diverse mechanisms of AKT pathway activation in human malignancy.Curr Cancer Drug Targets. 2013 Mar;13(3):234-44. doi: 10.2174/1568009611313030002. Curr Cancer Drug Targets. 2013. PMID: 23297823 Free PMC article. Review.
-
Mammalian target of rapamycin pathway mutations cause hemimegalencephaly and focal cortical dysplasia.Ann Neurol. 2015 Apr;77(4):720-5. doi: 10.1002/ana.24357. Epub 2015 Feb 26. Ann Neurol. 2015. PMID: 25599672 Free PMC article.
-
Genetic changes shaping the human brain.Dev Cell. 2015 Feb 23;32(4):423-34. doi: 10.1016/j.devcel.2015.01.035. Dev Cell. 2015. PMID: 25710529 Free PMC article. Review.
-
Non-Cell-Autonomous Mechanisms in Radial Projection Neuron Migration in the Developing Cerebral Cortex.Front Cell Dev Biol. 2020 Sep 25;8:574382. doi: 10.3389/fcell.2020.574382. eCollection 2020. Front Cell Dev Biol. 2020. PMID: 33102480 Free PMC article. Review.
-
The mTOR pathway in treatment of epilepsy: a clinical update.Future Neurol. 2018 May;13(2):49-58. doi: 10.2217/fnl-2018-0001. Epub 2018 May 29. Future Neurol. 2018. PMID: 30505235 Free PMC article.
References
-
- Arai Y, Edwards V, Becker LE. A comparison of cell phenotypes in hemimegalencephaly and tuberous sclerosis. Acta Neuropathol. 1999;98:407–413. - PubMed
-
- Ballif BC, Rosenfeld JA, Traylor R, Theisen A, Bader PI, Ladda RL, Sell SL, Steinraths M, Surti U, McGuire M, et al. High-resolution array CGH defines critical regions and candidate genes for microcephaly, abnormalities of the corpus callosum, and seizure phenotypes in patients with microdeletions of 1q43q44. Hum Genet. 2012;131:145–156. - PubMed
-
- Boland E, Clayton-Smith J, Woo VG, McKee S, Manson FD, Medne L, Zackai E, Swanson EA, Fitzpatrick D, Millen KJ, et al. Mapping of deletion and translocation breakpoints in 1q44 implicates the serine/threonine kinase AKT3 in postnatal microcephaly and agenesis of the corpus callosum. Am J Hum Genet. 2007;81:292–303. - PMC - PubMed
Publication types
MeSH terms
Substances
Grants and funding
- R01 NS35129/NS/NINDS NIH HHS/United States
- R00 NS072192/NS/NINDS NIH HHS/United States
- R01 NS032457/NS/NINDS NIH HHS/United States
- HHMI/Howard Hughes Medical Institute/United States
- P01 CA142536/CA/NCI NIH HHS/United States
- T32 GM007753/GM/NIGMS NIH HHS/United States
- R01 NS079277/NS/NINDS NIH HHS/United States
- P30 HD018655/HD/NICHD NIH HHS/United States
- K99/R00 NS072192/NS/NINDS NIH HHS/United States
- R01 NS035129/NS/NINDS NIH HHS/United States
- K23NS069784/NS/NINDS NIH HHS/United States
- K23 NS069784/NS/NINDS NIH HHS/United States
- K08 NS047213/NS/NINDS NIH HHS/United States
LinkOut - more resources
Full Text Sources
Medical
Molecular Biology Databases
Miscellaneous

