. 2011 Jun;193(11):2756-66.
doi: 10.1128/JB.00205-11. Epub 2011 Mar 25.

Combinatorial regulation by MrpC2 and FruA involves three sites in the fmgE promoter region during Myxococcus xanthus development

Affiliations

Combinatorial regulation by MrpC2 and FruA involves three sites in the fmgE promoter region during Myxococcus xanthus development

Bongjun Son et al. J Bacteriol. 2011 Jun.

Abstract

Starvation causes cells in a dense population of Myxococcus xanthus to change their gliding movements and construct mounds. Short-range C-signaling between rod-shaped cells within mounds induces gene expression that promotes differentiation into spherical spores. Several C-signal-dependent genes have been shown to be regulated by cooperative binding of two transcription factors to the promoter region. These FruA- and MrpC2-regulated genes (designated fmg) each exhibit a different arrangement of binding sites. Here, we describe fmgE, which appears to be regulated by three sites for cooperative binding of FruA and MrpC2. Chromatin immunoprecipitation analysis showed that association of MrpC2 and/or its longer form, MrpC with the fmgE promoter region, depends on FruA, consistent with cooperative binding of the two proteins in vivo. Electrophoretic mobility shift assays with purified His(10)-MrpC2 and FruA-His(6) indicated cooperative binding in vitro to three sites in the fmgE promoter region. The effects of mutations on binding in vitro and on expression of fmgE-lacZ fusions correlated site 1 (at about position -100 relative to the transcriptional start site) with negative regulation and site 2 (just upstream of the promoter) and site 3 (at about position +100) with positive regulation. Site 3 was bound by His(10)-MrpC2 alone, or the combination of His(10)-MrpC2 and FruA-His(6), with the highest affinity, followed by site 1 and then site 2, supporting a model in which site 3 recruits MrpC2 and FruA to the fmgE promoter region, site 1 competes with site 2 for transcription factor binding, and site 2 occupancy is required to activate the promoter but only occurs when C-signaling produces a high concentration of active FruA.


Figures
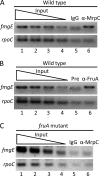
Fig. 1.
Fig. 1.
Association of MrpC and/or MrpC2 and FruA with the fmgE promoter region during development. ChIP analysis of M. xanthus at 18 h into development. Cells were treated with formaldehyde and lysed. Cross-linked chromatin was immunoprecipitated with antibodies. DNA was amplified with primers for the fmgE promoter region (positions −100 to +50 relative to the start site of transcription) or for the rpoC coding region (positions +1780 to +1905 relative to the predicted translation start) as a control. A 2-fold dilution series of input DNA purified from 0.025, 0.0125, 0.00625, or 0.003125% of the total cellular extract prior to immunoprecipitation was used as a template in parallel PCRs to show that the PCR conditions allow detection of differences in DNA concentration for each primer set. (A) Wild-type strain DK1622 with affinity-purified IgG antibodies against MrpC (α-MrpC) or, as a control, with total IgG (IgG) from nonimmunized rabbits. (B) Wild-type strain DK1622 with antiserum against FruA (α-FruA) or, as a control, preimmune antiserum (Pre). (C) fruA mutant strain DK5285 with antibodies as shown in panel A.
Fig. 2.
Fig. 2.
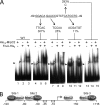
Binding of MrpC2 and FruA to the fmgE promoter region. (A) Effects of mutations in the fmgE promoter region on fmgE-lacZ expression in vivo and on MrpC2 and FruA binding in vitro. (Top) Summary of the effects of four mutations on developmental fmgE-lacZ expression (55). The mutations are shown, and the numbers indicate the maximum β-galactosidase activity during development, expressed as a percentage of the maximum activity observed for the wild-type promoter. (Bottom) EMSAs with 32P-labeled fmgE DNA (2 nM) spanning from positions −100 to −25 and His10-MrpC2 (1 μM), FruA-His6 (3 μM), or both His10-MrpC2 (1 μM) and FruA-His6 (3 μM), as indicated. The probe DNA had the wild-type (WT) sequence or the indicated mutation. The filled arrowhead points to the shifted complex produced by His10-MrpC2 alone, and the open arrowhead points to the complex produced by FruA-His6 alone. (B) Summary of binding sites for MrpC2 and FruA in the fmgE promoter region. The approximate location and relative positions of MrpC2 and FruA at sites 1, 2, and 3 are deduced from the effects of 5′-end deletions, the mutations shown in panel A, and 3′-end deletions, respectively, on binding in vitro, as explained in the text. The position of MrpC2 binding alone, depicted upstream of position +50, is less precisely known but lies between positions −25 and +50.
Fig. 3.
Fig. 3.
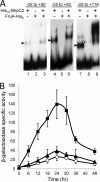
MrpC2 and FruA bind to a downstream positive regulatory element. (A) Binding of MrpC2 and FruA to site 3. EMSAs with 32P-labeled fmgE DNA (2 nM) spanning from position −25 to the indicated 3′ ends and His10-MrpC2 (1 μM), FruA-His6 (3 μM), or both His10-MrpC2 (1 μM) and FruA-His6 (3 μM), as indicated. The filled arrowhead points to the shifted complex produced by His10-MrpC2 alone, and the open arrowhead points to the complex produced by FruA-His6 alone. (B) Effects of 3′-end deletions on developmental fmgE-lacZ expression. β-Galactosidase specific activity during development was measured for lacZ fused to fmgE spanning from positions −100 to +50 (▴), −100 to +93 (○), or −100 to +116 (■). The units of activity are nanomoles of o-nitrophenyl phosphate per minute per milligram of protein. Points show the average values of three transformants, and each error bar depicts 1 standard deviation of the data.
Fig. 4.
Fig. 4.
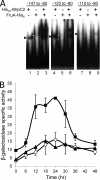
MrpC2 and FruA bind to an upstream negative regulatory element. (A) Binding of MrpC2 and FruA to site 1. EMSAs with 32P-labeled fmgE DNA (2 nM) spanning from the indicated 5′ ends to position −80 and His10-MrpC2 (1 μM), FruA-His6 (3 μM), or both His10-MrpC2 (1 μM) and FruA-His6 (3 μM), as indicated. The filled arrowhead points to the shifted complex produced by His10-MrpC2 alone, and the open arrowhead points to the complex produced by FruA-His6 alone. (B) Effects of 5′-end deletions on developmental fmgE-lacZ expression. β-Galactosidase specific activity during development was measured for lacZ fused to fmgE spanning from positions −150 to +50 (▴), −120 to +50 (○), or −110 to +50 (■). The units of activity are nanomoles of o-nitrophenyl phosphate per minute per milligram of protein. Points show the average values of two or three transformants, and each error bars depicts 1 standard deviation of the data.
Fig. 5.
Fig. 5.
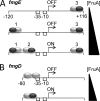
Models for C-signal-dependent regulation of fmgE and fmgD. As development proceeds, C-signaling causes the concentration of active FruA to rise (triangles). (A) In the fmgE promoter region, three sites for cooperative binding of MrpC2 (light gray ovals) and FruA (dark gray ovals) are occupied in the order of their affinities for the two transcription factors, first site 3, then site 1, and finally site 2, resulting in activation of transcription. (B) In the fmgD promoter region, cooperative binding of two MrpC2 initially represses transcription, but eventually FruA outcompetes the downstream MrpC2 for binding to the upstream MrpC2, activating transcription. Activation of fmgD might occur at a slightly lower concentration of active FruA than activation of fmgE (see Discussion).
Fig. 6.
Fig. 6.
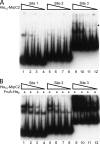
Relative affinities of MrpC2, and the combination of MrpC2 and FruA, for sites 1, 2, and 3 in the fmgE promoter region. (A) Binding of MrpC2 to sites 1, 2, and 3. EMSAs with 32P-labeled fmgE DNA (2 nM) spanning from positions −147 to −80 (site 1), from positions −100 to −25 (site 2), or from positions −25 to +116 (site 3) and His10-MrpC2 at decreasing concentrations (1, 0.5, 0.25, and 0.125 μM). The asterisk denotes a band observed in lanes 9 to 12, which was also observed in the absence of His10-MrpC2 (data not shown), and therefore appears to be a minor contaminant of this probe preparation rather than a shifted complex. (B) Binding of MrpC2 and FruA to sites 1, 2, and 3. EMSAs with 32P-labeled fmgE DNA and His10-MrpC2 at decreasing concentrations, as shown in panel A, and with FruA-His6 (3 μM).

Similar articles

Cited by

References

    1. Altschul S. F., Gish W., Miller W., Myers E. W., Lipman D. J. 1990. Basic local alignment search tool. J. Mol. Biol. 215:403–410 - PubMed
    1. Bassler B. L., Losick R. 2006. Bacterially speaking. Cell 125:237–246 - PubMed
    1. Berleman J. E., Kirby J. R. 2009. Deciphering the hunting strategy of a bacterial wolfpack. FEMS Microbiol. Rev. 33:942–957 - PMC - PubMed
    1. Cowan J. M., Urbanowski M. L., Talmi M., Stauffer G. V. 1993. Regulation of the Salmonella typhimurium metF gene by the MetR protein. J. Bacteriol. 175:5862–5866 - PMC - PubMed
    1. Dunn T. M., Hahn S., Ogden S., Schleif R. F. 1984. An operator at −280 base pairs that is required for repression of araBAD operon promoter: addition of DNA helical turns between the operator and promoter cyclically hinders repression. Proc. Natl. Acad. Sci. U. S. A. 81:5017–5020 - PMC - PubMed

Publication types

MeSH terms

LinkOut - more resources