

Variable K(+) channel subunit dysfunction in inherited mutations of KCNA1
- PMID: 11773313
- PMCID: PMC2290030
- DOI: 10.1113/jphysiol.2001.013242
Variable K(+) channel subunit dysfunction in inherited mutations of KCNA1
Abstract
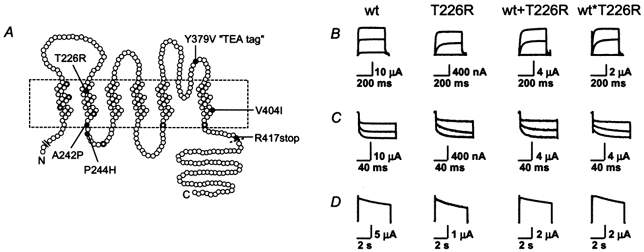
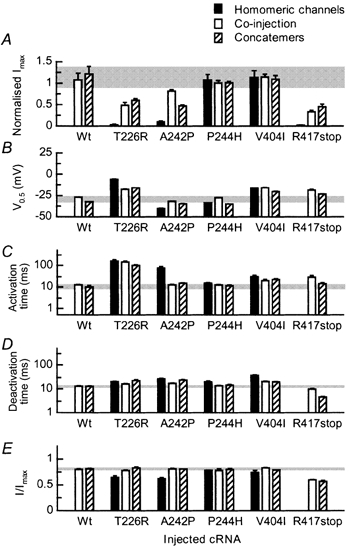
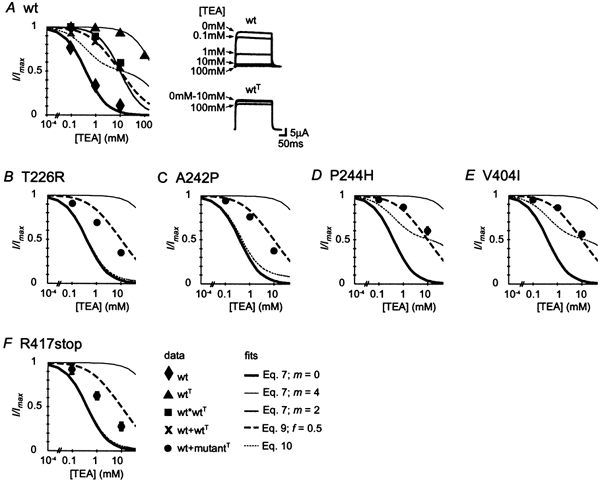
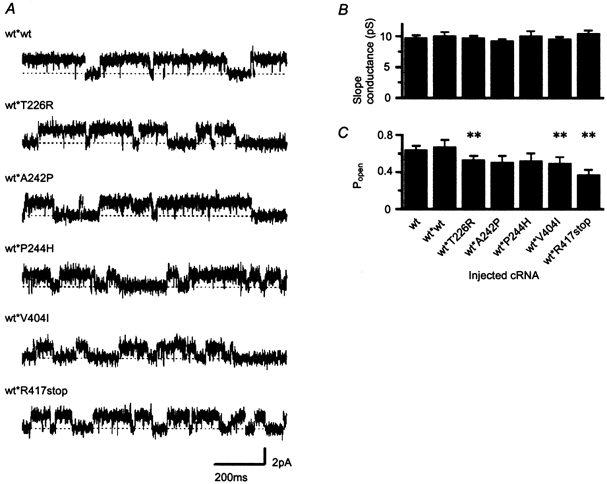
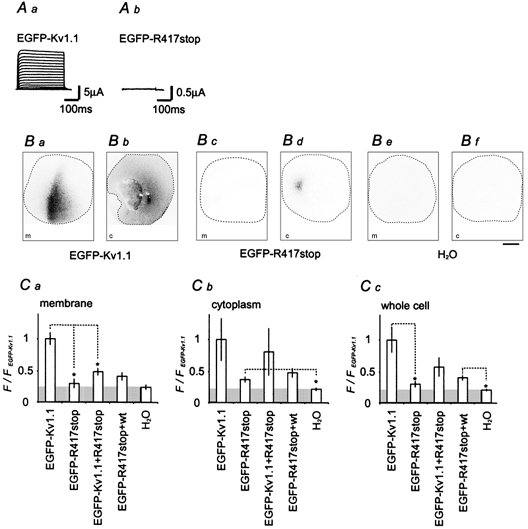
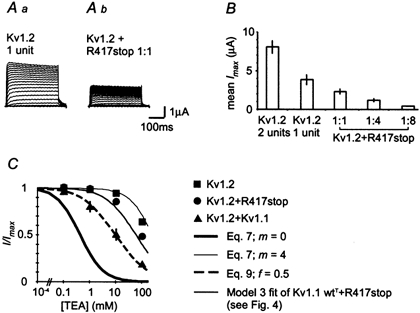
Mutations of KCNA1, which codes for the K(+) channel subunit hKv1.1, are associated with the human autosomal dominant disease episodic ataxia type 1 (EA1). Five recently described mutations are associated with a broad range of phenotypes: neuromyotonia alone or with seizures, EA1 with seizures, or very drug-resistant EA1. Here we investigated the consequences of each mutation for channel assembly, trafficking, gating and permeation. We related data obtained from co-expression of mutant and wild-type hKv1.1 to the results of expressing mutant-wild-type fusion proteins, and combined electrophysiological recordings in Xenopus oocytes with a pharmacological discrimination of the contribution of mutant and wild-type subunits to channels expressed at the membrane. We also applied confocal laser scanning microscopy to measure the level of expression of either wild-type or mutant subunits tagged with green fluorescent protein (GFP). R417stop truncates most of the C-terminus and is associated with severe drug-resistant EA1. Electrophysiological and pharmacological measurements indicated that the mutation impairs both tetramerisation of R417stop with wild-type subunits, and membrane targeting of heterotetramers. This conclusion was supported by confocal laser scanning imaging of enhanced GFP (EGFP)-tagged hKv1.1 subunits. Co-expression of R417stop with wild-type hKv1.2 subunits yielded similar results to co-expression with wild-type hKv1.1. Mutations associated with typical EA1 (V404I) or with neuromyotonia alone (P244H) significantly affected neither tetramerisation nor trafficking, and only altered channel kinetics. Two other mutations associated with a severe phenotype (T226R, A242P) yielded an intermediate result. The phenotypic variability of KCNA1 mutations is reflected in a wide range of disorders of channel assembly, trafficking and kinetics.
Figures

Similar articles
-
Episodic ataxia type 1 mutations in the KCNA1 gene impair the fast inactivation properties of the human potassium channels Kv1.4-1.1/Kvbeta1.1 and Kv1.4-1.1/Kvbeta1.2.Eur J Neurosci. 2006 Dec;24(11):3073-83. doi: 10.1111/j.1460-9568.2006.05186.x. Eur J Neurosci. 2006. PMID: 17156368
-
Episodic ataxia mutations in Kv1.1 alter potassium channel function by dominant negative effects or haploinsufficiency.J Neurosci. 1998 Apr 15;18(8):2842-8. doi: 10.1523/JNEUROSCI.18-08-02842.1998. J Neurosci. 1998. PMID: 9526001 Free PMC article.
-
Episodic ataxia type-1 mutations in the hKv1.1 cytoplasmic pore region alter the gating properties of the channel.EMBO J. 1998 Mar 2;17(5):1200-7. doi: 10.1093/emboj/17.5.1200. EMBO J. 1998. PMID: 9482717 Free PMC article.
-
Kv1.1 Channelopathies: Pathophysiological Mechanisms and Therapeutic Approaches.Int J Mol Sci. 2020 Apr 22;21(8):2935. doi: 10.3390/ijms21082935. Int J Mol Sci. 2020. PMID: 32331416 Free PMC article. Review.
-
Episodic ataxias 1 and 2.Handb Clin Neurol. 2012;103:595-602. doi: 10.1016/B978-0-444-51892-7.00042-5. Handb Clin Neurol. 2012. PMID: 21827920 Review.
Cited by
-
Episodic ataxia type 1 mutations differentially affect neuronal excitability and transmitter release.Dis Model Mech. 2009 Nov-Dec;2(11-12):612-9. doi: 10.1242/dmm.003582. Epub 2009 Sep 24. Dis Model Mech. 2009. PMID: 19779067 Free PMC article.
-
Two novel KCNA1 variants identified in two unrelated Chinese families affected by episodic ataxia type 1 and neurodevelopmental disorders.Mol Genet Genomic Med. 2020 Oct;8(10):e1434. doi: 10.1002/mgg3.1434. Epub 2020 Jul 23. Mol Genet Genomic Med. 2020. PMID: 32705822 Free PMC article.
-
Mutations in KCND3 cause spinocerebellar ataxia type 22.Ann Neurol. 2012 Dec;72(6):859-69. doi: 10.1002/ana.23701. Ann Neurol. 2012. PMID: 23280837 Free PMC article.
-
Episodic ataxia type 1 mutations in the human Kv1.1 potassium channel alter hKvbeta 1-induced N-type inactivation.J Neurosci. 2002 Jun 15;22(12):4786-93. doi: 10.1523/JNEUROSCI.22-12-04786.2002. J Neurosci. 2002. PMID: 12077175 Free PMC article.
-
Precision physiology and rescue of brain ion channel disorders.J Gen Physiol. 2017 May 1;149(5):533-546. doi: 10.1085/jgp.201711759. Epub 2017 Apr 20. J Gen Physiol. 2017. PMID: 28428202 Free PMC article. Review.
References
-
- Adelman JP, Bond CT, Pessia M, Maylie J. Episodic ataxia results from voltage-dependent potassium channels with altered functions. Neuron. 1995;15:1449–1454. - PubMed
-
- Biervert C, Schroeder BC, Kubisch C, Berkovic SF, Propping P, Jentsch TJ, Steinlein OK. A potassium channel mutation in neonatal human epilepsy. Science. 1998;279:403–406. - PubMed
-
- Boland LM, Price DL, Jackson KA. Episodic ataxia/myokymia mutations functionally expressed in the Shaker potassium channel. Neuroscience. 1999;91:1557–1564. - PubMed
-
- Bretschneider F, Wrisch A, Lehmann-Horn F, Grissmer S. Expression in mammalian cells and electrophysiological characterization of two mutant Kv1. 1 channels causing episodic ataxia type 1 (EA-1) European Journal of Neuroscience. 1999;11:2403–2412. - PubMed
-
- Browne DL, Gancher ST, Nutt JG, Brunt ER, Smith EA, Kramer P, Litt M. Episodic ataxia/myokymia syndrome is associated with point mutations in the human potassium channel gene, KCNA1. Nature Genetics. 1994;8:136–140. - PubMed
Publication types
MeSH terms
Substances
LinkOut - more resources
Full Text Sources
Other Literature Sources
Medical
Molecular Biology Databases