Lifespan extension and delayed immune and collagen aging in mutant mice with defects in growth hormone production
- PMID: 11371619
- PMCID: PMC34422
- DOI: 10.1073/pnas.111158898
Lifespan extension and delayed immune and collagen aging in mutant mice with defects in growth hormone production
Abstract
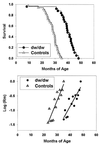
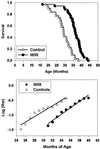
Single-gene mutations that extend lifespan provide valuable tools for the exploration of the molecular basis for age-related changes in cell and tissue function and for the pathophysiology of age-dependent diseases. We show here that mice homozygous for loss-of-function mutations at the Pit1 (Snell dwarf) locus show a >40% increase in mean and maximal longevity on the relatively long-lived (C3H/HeJ x DW/J)F(1) background. Mutant dw(J)/dw animals show delays in age-dependent collagen cross-linking and in six age-sensitive indices of immune system status. These findings thus demonstrate that a single gene can control maximum lifespan and the timing of both cellular and extracellular senescence in a mammal. Pituitary transplantation into dwarf mice does not reverse the lifespan effect, suggesting that the effect is not due to lowered prolactin levels. In contrast, homozygosity for the Ghrhr(lit) mutation, which like the Pit1(dw) mutation lowers plasma growth hormone levels, does lead to a significant increase in longevity. Male Snell dwarf mice, unlike calorically restricted mice, become obese and exhibit proportionately high leptin levels in old age, showing that their exceptional longevity is not simply due to alterations in adiposity per se. Further studies of the Pit1(dw) mutant, and the closely related, long-lived Prop-1(df) (Ames dwarf) mutant, should provide new insights into the hormonal regulation of senescence, longevity, and late life disease.
Figures


Similar articles
-
Effects of the Pit1 mutation on the insulin signaling pathway: implications on the longevity of the long-lived Snell dwarf mouse.Mech Ageing Dev. 2002 May;123(9):1245-55. doi: 10.1016/s0047-6374(02)00037-4. Mech Ageing Dev. 2002. PMID: 12020946
-
The Snell dwarf mutation Pit1(dw) can increase life span in mice.Mech Ageing Dev. 2002 Jan;123(2-3):121-30. doi: 10.1016/s0047-6374(01)00339-6. Mech Ageing Dev. 2002. PMID: 11718806
-
Hormone-treated snell dwarf mice regain fertility but remain long lived and disease resistant.J Gerontol A Biol Sci Med Sci. 2004 Dec;59(12):1244-50. doi: 10.1093/gerona/59.12.1244. J Gerontol A Biol Sci Med Sci. 2004. PMID: 15699523 Free PMC article.
-
Altered structure and function of adipose tissue in long-lived mice with growth hormone-related mutations.Adipocyte. 2017 Apr 3;6(2):69-75. doi: 10.1080/21623945.2017.1308990. Epub 2017 Mar 21. Adipocyte. 2017. PMID: 28425851 Free PMC article. Review.
-
Calorie restriction and dwarf mice in gerontological research.Gerontology. 2010;56(4):404-9. doi: 10.1159/000235720. Epub 2009 Aug 19. Gerontology. 2010. PMID: 19690401 Review.
Cited by
-
Discovery of functional gene variants associated with human longevity: opportunities and challenges.J Gerontol A Biol Sci Med Sci. 2012 Apr;67(4):376-83. doi: 10.1093/gerona/glr200. Epub 2011 Dec 7. J Gerontol A Biol Sci Med Sci. 2012. PMID: 22156437 Free PMC article.
-
Activation of genes involved in xenobiotic metabolism is a shared signature of mouse models with extended lifespan.Am J Physiol Endocrinol Metab. 2012 Aug 15;303(4):E488-95. doi: 10.1152/ajpendo.00110.2012. Epub 2012 Jun 12. Am J Physiol Endocrinol Metab. 2012. PMID: 22693205 Free PMC article.
-
Longevity: Lesson from Model Organisms.Genes (Basel). 2019 Jul 9;10(7):518. doi: 10.3390/genes10070518. Genes (Basel). 2019. PMID: 31324014 Free PMC article. Review.
-
Life span extension by reduction in growth hormone-insulin-like growth factor-1 axis in a transgenic rat model.Am J Pathol. 2002 Jun;160(6):2259-65. doi: 10.1016/S0002-9440(10)61173-X. Am J Pathol. 2002. PMID: 12057928 Free PMC article.
-
Evolutionary conservation of regulated longevity assurance mechanisms.Genome Biol. 2007;8(7):R132. doi: 10.1186/gb-2007-8-7-r132. Genome Biol. 2007. PMID: 17612391 Free PMC article.
References
-
- Lin Y J, Seroude L, Benzer S. Science. 1998;282:943–946. - PubMed
-
- Lin K, Dorman J B, Rodan A, Kenyon C. Science. 1997;278:1319–1322. - PubMed
-
- Kimura K D, Tissenbaum H A, Liu Y, Ruvkun G. Science. 1997;277:942–946. - PubMed
-
- Brown-Borg H M, Borg K E, Meliska C J, Bartke A. Nature (London) 1996;384:33–33. - PubMed
Publication types
MeSH terms
Substances
Grants and funding
LinkOut - more resources
Full Text Sources
Other Literature Sources
Medical
Molecular Biology Databases
Miscellaneous

