Rapid restoration of visual pigment and function with oral retinoid in a mouse model of childhood blindness
- PMID: 10869443
- PMCID: PMC26998
- DOI: 10.1073/pnas.150236297
Rapid restoration of visual pigment and function with oral retinoid in a mouse model of childhood blindness
Abstract
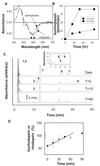
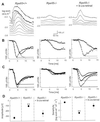
Mutations in the retinal pigment epithelium gene encoding RPE65 are a cause of the incurable early-onset recessive human retinal degenerations known as Leber congenital amaurosis. Rpe65-deficient mice, a model of Leber congenital amaurosis, have no rod photopigment and severely impaired rod physiology. We analyzed retinoid flow in this model and then intervened by using oral 9-cis-retinal, attempting to bypass the biochemical block caused by the genetic abnormality. Within 48 h, there was formation of rod photopigment and dramatic improvement in rod physiology, thus demonstrating that mechanism-based pharmacological intervention has the potential to restore vision in otherwise incurable genetic retinal degenerations.
Figures

 ).
).


Similar articles
-
Recovery of visual functions in a mouse model of Leber congenital amaurosis.J Biol Chem. 2002 May 24;277(21):19173-82. doi: 10.1074/jbc.M112384200. Epub 2002 Mar 15. J Biol Chem. 2002. PMID: 11897783 Free PMC article.
-
Retinal degeneration 12 (rd12): a new, spontaneously arising mouse model for human Leber congenital amaurosis (LCA).Mol Vis. 2005 Feb 28;11:152-62. Mol Vis. 2005. PMID: 15765048
-
Rpe65-/- and Lrat-/- mice: comparable models of leber congenital amaurosis.Invest Ophthalmol Vis Sci. 2008 Jun;49(6):2384-9. doi: 10.1167/iovs.08-1727. Epub 2008 Feb 22. Invest Ophthalmol Vis Sci. 2008. PMID: 18296659 Free PMC article.
-
RPE65: role in the visual cycle, human retinal disease, and gene therapy.Ophthalmic Genet. 2009 Jun;30(2):57-62. doi: 10.1080/13816810802626399. Ophthalmic Genet. 2009. PMID: 19373675 Free PMC article. Review.
-
Leber's congenital amaurosis and RPE65.Int Ophthalmol Clin. 2001 Winter;41(1):73-82. doi: 10.1097/00004397-200101000-00008. Int Ophthalmol Clin. 2001. PMID: 11198148 Review. No abstract available.
Cited by
-
M-opsin protein degradation is inhibited by MG-132 in Rpe65⁻/⁻ retinal explant culture.Mol Vis. 2012;18:1516-25. Epub 2012 Jun 13. Mol Vis. 2012. PMID: 22736942 Free PMC article.
-
A point mutation in Semaphorin 4A associates with defective endosomal sorting and causes retinal degeneration.Nat Commun. 2013;4:1406. doi: 10.1038/ncomms2420. Nat Commun. 2013. PMID: 23360997 Free PMC article.
-
Chemical chaperone TUDCA preserves cone photoreceptors in a mouse model of Leber congenital amaurosis.Invest Ophthalmol Vis Sci. 2012 Jun 5;53(7):3349-56. doi: 10.1167/iovs.12-9851. Invest Ophthalmol Vis Sci. 2012. PMID: 22531707 Free PMC article.
-
Molecular Basis for Vitamin A Uptake and Storage in Vertebrates.Nutrients. 2016 Oct 26;8(11):676. doi: 10.3390/nu8110676. Nutrients. 2016. PMID: 27792183 Free PMC article. Review.
-
The Rpe65 Leu450Met variation increases retinal resistance against light-induced degeneration by slowing rhodopsin regeneration.J Neurosci. 2001 Jan 1;21(1):53-8. doi: 10.1523/JNEUROSCI.21-01-00053.2001. J Neurosci. 2001. PMID: 11150319 Free PMC article.
References
-
- Polans A, Baehr W, Palczewski K. Trends Neurosci. 1996;19:547–554. - PubMed
-
- Lagnado L, Baylor D. Neuron. 1992;8:995–1002. - PubMed
-
- Rando R R. Chem Biol. 1996;3:255–262. - PubMed
-
- Palczewski K, Saari J C. Curr Opin Neurobiol. 1997;7:500–504. - PubMed
-
- Bavik C O, Busch C, Eriksson U. J Biol Chem. 1992;267:23035–23042. - PubMed
Publication types
MeSH terms
Substances
Grants and funding
LinkOut - more resources
Full Text Sources
Other Literature Sources
Molecular Biology Databases

