Characteristics of drugs for ultra-rare diseases versus drugs for other rare diseases in HTA submissions made to the CADTH CDR
- PMID: 29386040
- PMCID: PMC5793441
- DOI: 10.1186/s13023-018-0762-1
Characteristics of drugs for ultra-rare diseases versus drugs for other rare diseases in HTA submissions made to the CADTH CDR
Abstract
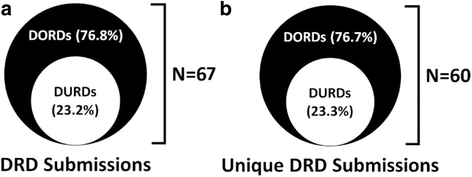
Background: It has been suggested that ultra-rare diseases should be recognized as distinct from more prevalent rare diseases, but how drugs developed to treat ultra-rare diseases (DURDs) might be distinguished from drugs for 'other' rare diseases (DORDs) is not clear. We compared the characteristics of DURDs to DORDs from a health technology assessment (HTA) perspective in submissions made to the CADTH Common Drug Review. We defined a DURD as a drug used to treat a disease with a prevalence ≤ 1 patient per 100,000 people, a DORD as a drug used to treat a disease with a prevalence > 1 and ≤ 50 patients per 100,000 people. We assessed differences in the level and quantity of evidence supporting each HTA submission, the molecular basis of treatment agents, annual treatment cost per patient, type of reimbursement recommendation made by CADTH, and reasons for negative recommendations.
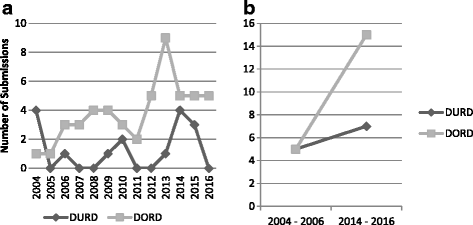
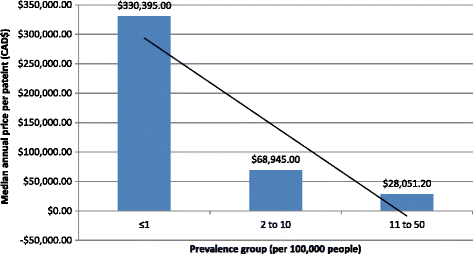
Results: We analyzed 14 DURD and 46 DORD submissions made between 2004 and 2016. Compared to DORDs, DURDs were more likely to be biologic drugs (OR = 6.06, 95%CI 1.25 to 38.58), to have been studied in uncontrolled clinical trials (OR = 23.11, 95%CI 2.23 to 1207.19), and to have a higher annual treatment cost per patient (median difference = CAN$243,787.75, 95%CI CAN$83,396 to CAN$329,050). Also, submissions for DURDs were associated with a less robust evidence base versus DORDs, as DURD submissions were less likely to include data from at least one double-blinded randomized controlled trial (OR = 0.13, 95%CI 0.02 to 0.70) and have smaller patient cohorts in clinical trials (median difference = -108, 95%CI -234 to -50). Furthermore, DURDs are less likely to receive a positive reimbursement recommendation (OR = 0.22, 95%CI 0.05 to 0.91), and low level of evidence was the major contributor for a negative recommendation.
Conclusions: The results suggest that DURDs could be viewed as distinct category from an HTA perspective. Applying the same HTA decision-making framework to DURDs and DORDs might have contributed the higher rate of negative reimbursement recommendations made for DURDs. Recognition of DURDs as a distinct subgroup of DRDs by explicitly defining DURDs based on objective criteria may facilitate the implementation of HTA assessment process that accounts for the issues associated with DURD.
Keywords: Canada; Orphan drugs; Rare diseases; Technology assessment, health; Ultra-rare diseases.
Conflict of interest statement
Ethics approval and consent to participate
Not applicable.
Consent for publication
Not applicable.
Competing interests
The authors declare that they have no competing interests.
Publisher’s Note
Springer Nature remains neutral with regard to jurisdictional claims in published maps and institutional affiliations.
Figures


Similar articles
-
Health technology assessment of drugs for rare diseases: insights, trends, and reasons for negative recommendations from the CADTH common drug review.Orphanet J Rare Dis. 2016 Dec 1;11(1):164. doi: 10.1186/s13023-016-0539-3. Orphanet J Rare Dis. 2016. PMID: 27908281 Free PMC article. Review.
-
Alignment of health technology assessments and price negotiations for new drugs for rare disorders in Canada: Does it lead to improved patient access?J Popul Ther Clin Pharmacol. 2020 Feb 13;27(1):e48-e64. doi: 10.15586/jptcp.v27i1.658. J Popul Ther Clin Pharmacol. 2020. PMID: 32124580
-
Health technology assessment of new drugs for rare disorders in Canada: impact of disease prevalence and cost.Orphanet J Rare Dis. 2017 Mar 23;12(1):59. doi: 10.1186/s13023-017-0611-7. Orphanet J Rare Dis. 2017. PMID: 28330479 Free PMC article.
-
Factors associated with positive and negative recommendations for cancer and non-cancer drugs for rare diseases in Canada.Orphanet J Rare Dis. 2019 Jun 7;14(1):127. doi: 10.1186/s13023-019-1104-7. Orphanet J Rare Dis. 2019. PMID: 31174574 Free PMC article.
-
Can Standard Health Technology Assessment Approaches Help Guide the Price of Orphan Drugs in Canada? A Review of Submissions to the Canadian Agency for Drugs and Technologies in Health Common Drug Review.Clinicoecon Outcomes Res. 2020 Aug 24;12:445-457. doi: 10.2147/CEOR.S264589. eCollection 2020. Clinicoecon Outcomes Res. 2020. PMID: 32922050 Free PMC article. Review.
Cited by
-
An international comparative analysis of public reimbursement of orphan drugs in Canadian provinces compared to European countries.Orphanet J Rare Dis. 2022 Mar 4;17(1):113. doi: 10.1186/s13023-022-02260-6. Orphanet J Rare Dis. 2022. PMID: 35246200 Free PMC article.
-
Treatment Guidelines for Rare, Early-Onset, Treatment-Resistant Epileptic Conditions: A Literature Review on Dravet Syndrome, Lennox-Gastaut Syndrome and CDKL5 Deficiency Disorder.Front Neurol. 2021 Oct 25;12:734612. doi: 10.3389/fneur.2021.734612. eCollection 2021. Front Neurol. 2021. PMID: 34759881 Free PMC article.
-
A master protocol to investigate a novel therapy acetyl-L-leucine for three ultra-rare neurodegenerative diseases: Niemann-Pick type C, the GM2 gangliosidoses, and ataxia telangiectasia.Trials. 2021 Jan 22;22(1):84. doi: 10.1186/s13063-020-05009-3. Trials. 2021. PMID: 33482890 Free PMC article.
-
FDA approval, clinical trial evidence, efficacy, epidemiology, and price for non-orphan and ultra-rare, rare, and common orphan cancer drug indications: cross sectional analysis.BMJ. 2023 May 9;381:e073242. doi: 10.1136/bmj-2022-073242. BMJ. 2023. PMID: 37160306 Free PMC article.
-
Associations between uncertainties identified by the European Medicines Agency and national decision making on reimbursement by HTA agencies.Clin Transl Sci. 2021 Jul;14(4):1566-1577. doi: 10.1111/cts.13027. Epub 2021 May 1. Clin Transl Sci. 2021. PMID: 33786991 Free PMC article.
References
-
- Hadjivasiliou A. Orphan drug report 2015. EvaluatePharma; 2015 October 2015.
-
- Tordrup D, Tzouma V, Kanavos P. Orphan drug considerations in health technology assessment in eight European countries. Rare Dis Orphan Drugs: Intl J Public Health. 2014;1(3):86–97.
-
- Richter T, Nestler-Parr S, Babela R, Khan ZM, Tesoro T, Molsen E, et al. Rare disease terminology and definitions-a systematic global review: report of the ISPOR rare disease special interest group. Value in Health: J Int Soc Pharmacoeco Outcomes Res 2015;18(6):906-914. - PubMed
Publication types
MeSH terms
LinkOut - more resources
Full Text Sources
Other Literature Sources
Medical

