. 2024 Nov 19;13(22):1913.
doi: 10.3390/cells13221913.

MYBPC3 D389V Variant Induces Hypercontractility in Cardiac Organoids

Affiliations

MYBPC3 D389V Variant Induces Hypercontractility in Cardiac Organoids

Darshini Desai et al. Cells. .

Abstract

MYBPC3, encoding cardiac myosin binding protein-C (cMyBP-C), is the most mutated gene known to cause hypertrophic cardiomyopathy (HCM). However, since little is known about the underlying etiology, additional in vitro studies are crucial to defining the underlying molecular mechanisms. Accordingly, this study aimed to investigate the molecular mechanisms underlying the pathogenesis of HCM associated with a polymorphic variant (D389V) in MYBPC3 by using isogenic human-induced pluripotent stem cell (hiPSC)-derived cardiac organoids (hCOs). The hiPSC-derived cardiomyocytes (hiPSC-CMs) and hCOs were generated from human subjects to define the molecular, cellular, functional, and energetic changes caused by the MYBPC3D389V variant, which is associated with increased fractional shortening and highly prevalent in South Asian descendants. Recombinant C0-C2, N' region of cMyBP-C (wild-type and D389V), and myosin S2 proteins were also utilized to perform binding and motility assays in vitro. Confocal and electron microscopic analyses of hCOs generated from noncarriers (NC) and carriers of the MYBPC3D389V variant revealed the presence of highly organized sarcomeres. Furthermore, functional experiments showed hypercontractility, faster calcium cycling, and faster contractile kinetics in hCOs expressing MYBPC3D389V than NC hCOs. Interestingly, significantly increased cMyBP-C phosphorylation in MYBPC3D389V hCOs was observed, but without changes in total protein levels, in addition to higher oxidative stress and lower mitochondrial membrane potential (ΔΨm). Next, spatial mapping revealed the presence of endothelial cells, fibroblasts, macrophages, immune cells, and cardiomyocytes in the hCOs. The hypercontractile function was significantly improved after the treatment of the myosin inhibitor mavacamten (CAMZYOS®) in MYBPC3D389V hCOs. Lastly, various vitro binding assays revealed a significant loss of affinity in the presence of MYBPC3D389V with myosin S2 region as a likely mechanism for hypercontraction. Conceptually, we showed the feasibility of assessing the functional and molecular mechanisms of HCM using highly translatable hCOs through pragmatic experiments that led to determining the MYBPC3D389V hypercontractile phenotype, which was rescued by the administration of a myosin inhibitor.

Keywords: MYBPC3; cardiac organoids; hypercontraction; hypertrophic cardiomyopathy; mavacamten.


Conflict of interest statement

Sadayappan provides consulting and collaborative research studies to the Leducq Foundation (CURE-PLAN), Red Saree Inc., Alexion, Regel Therapeutics, Affinia Therapeutics Inc., Cardiocare Genetics—Cosmogene Skincare Pvt Ltd., but such work is unrelated to the content of this article.

Figures
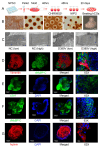
Figure 1
Figure 1
Generation and characterization of 3D cardiac organoids using hiPSC lines using Wnt signaling. (A,B) Cultured hiPSCs in a 6-well plate were seeded into the agarose mold for 48 h. The maintenance medium, mTESR1, was changed to RPMI 1640 containing B27 without insulin with the subsequent addition of CHIR99021 and then IWP4 to drive cardiomyocyte maturation. Organoids were transferred after 96 h to an ultra-low attachment plate with RPMI1640 medium supplemented with B27 plus insulin and changed every 48 h until beating. (C) Transmission electron microscopy analyses of hCOs on day 30 demonstrate representative sarcomeres with Z-bands in D389V and NC organoids. (DG) Representative wholemount cardiac organoid stained with (D) vimentin in red, cMyBP-C in green, and DAPI in blue, (E) cTnI in green and DAPI in blue, (F) cMyBP-C in green and DAPI in blue, and (G) α-actinin staining of the sarcomere in red and DAPI in blue. The last row represents the organoid area with higher magnification at 63X.
Figure 2
Figure 2
Hypercontractility was observed in D389V hCOs and was mitigated by mavacamten. Fresh beating hCOs on day 30 were used to measure contractile parameters using the IonOptix instrument. (A,B) Contraction and relaxation velocity in the absence and presence of 300 nM MyK-461 at 0.5 Hz frequency. (C,D) The time point taken to peak at 50% and 70% in the absence and presence of 300 nM MyK-461 at 0.5 Hz frequency. (E,F) Time to relax 90% and 50% was measured in the absence and presence of MyK-461 at 0.5 Hz frequency. The experiments were performed using n = 22 to 40 hCOs in 3 independent experiments on different days and averaged the data. Data are expressed as mean ± S.E.M. (error bars) of the number of hCOs. Statistical analyses in all groups were performed by ordinary two-way ANOVA, followed by a multiple-comparison test. For all groups: * p ≤ 0.05, ** p ≤ 0.01, *** p ≤ 0.001 and **** p ≤ 0.0001 and ns is non-significant.
Figure 3
Figure 3
Faster Ca2+ kinetics were determined in D389V hCOs, which were not altered by MyK-461. Fresh beating hCOs on day 30 were used to determine the amplitude and kinetics of intracellular Ca2+ transients using fluorescent Fura-2 am dye. (A) Representative intracellular diastolic calcium levels tracings. (B) Intracellular diastolic calcium levels in D389V and NC hCOs with and without 300 nM Myk-461. (C) Ca2+ transient amplitude as indicated by Fura-2 ratio (340/380 nm) in the absence and presence of 300 nM MyK-461 at 0.5 Hz with 1.8 mm Ca2+. (D) Time to 50% decay of the calcium transient in the absence and presence of MyK-461. We used n = 22 to 40 hCOs in 3 independent experiments on different days and averaged the data. Data are expressed as mean ± S.E.M. (error bars), and statistical analyses were performed for all groups by ordinary two-way ANOVA, followed by multiple-comparison test. * p ≤ 0.05, and **** p ≤ 0.0001 for all groups, ns is non-significant.
Figure 4
Figure 4
Expression of the D389V variant results in cellular hypertrophy and HCM phenotype, as evidenced by RNAseq analyses in hCOs. (A) Pathway enrichment analysis showing the KEGG, GOBP, and GOMF pathways for the upregulated genes in D389V hCOs compared to NC hCOs at day 30. (BE) Enrichment plot using the GSEA analysis of the genes regulating the cardiac muscle contraction, HCM pathway, oxidative phosphorylation, glycolysis–gluconeogenesis, and fatty acid metabolism in D389V hCOs. (FI) Heatmap representing DEGs associated with cardiac muscle contraction, HCM pathway, oxidative phosphorylation, glycolysis–gluconeogenesis, and fatty acid metabolism in D389V hCOs (n = 4 sample set with 25–30 organoids in each set; D389V vs. NC); (fold change cutoff 2, adjusted p-value < 0.05).
Figure 5
Figure 5
Expression of the D389V variant in hCOs increases the levels of cMyBP-C phosphorylation and oxidative stress. Total proteins were collected from hCOs on day 30 for Western blot analyses. (A) Representative of Western blot images and normalized protein expression levels comparing D389V and NC and hCOs. (BD) Quantification of protein expression of cMyBP-C normalized with GAPDH for all three blots. (E−G) Quantification of the phosphorylation of human cMyBP-C at serine 275, 284, and 304 normalized with the level of total cMyBP-C protein. Data are expressed as mean ± S.E.M (error bars) on the number of organoids, and statistical analyses were performed in all groups t-test unpaired test. * p ≤ 0.05; ** p ≤ 0.01 for all groups. (H) DCFDA stain fluorescence at 485/535 nm of NC and D389V at baseline and after NAC treatment. Organoids imaged in brightfield microscopy (middle panel). All images are of scale 1000 µm and images at magnitude of 4X. (I) Quantitation of the ROS generation measurement of the fluorescent intensity emitted by the DCFDA dye measured in the hCOs. Data are expressed as mean ± S.E.M (error bars) (n = 3 sample sets, each sample set containing 40–50 organoids), and statistical analyses were performed in all groups t-test unpaired test. *** p ≤ 0.001 for all groups. (J) Quantification of the membrane potential, measured as the fluorescent intensity in the organoids. Data are expressed as mean ± S.E.M. (error bars) on the number of wells consisting of cells isolated from organoids, and statistical analyses were performed in all groups t-test unpaired test. ** p ≤ 0.01 for all groups. ns is non-significant.
Figure 6
Figure 6
Spatial RNA detection determined all the cell types and cell–cell interactions in formalin-fixed paraffin-embedded hCOs. Fresh hCOs on day 30 were fixed in formalin, embedded in paraffin, and sectioned in 4–6 µm thickness for RNA profiling using a Human RNA TAP Panel (1000-plex) and SMI-0119 custom panel. (A) Uniform manifold approximation and projections of hCOs based on gene expression matrix in dimension 1 vs. dimension 2. Color denotes cell types from a to f types (a, a cluster of cells identified as a mixture of immune, endothelial, and fibroblast; b, macrophages; c, a cluster of cardiomyocytes, endothelial cells, and fibroblasts; d, cardiomyocytes; e, a cluster of cardiomyocytes; and f, immune cells). (B) Comparison of the gene expression levels in the same cluster of cells between D389V and NC hCOs in each cell type. (C) Heat map of gene expression profiles in each cluster in D389V and NC hCOs.
Figure 7
Figure 7
D389V mutation in the C2 domain of cMyBP-C reduces its binding to the myosin S2 region. (A) Co-sedimentation analysis of various recombinant hC0-C2 of cMyBP-C protein concentrations binding to full-length β-myosin heavy chains that were purified from mouse hearts. Quantification of bound hC0-C2 with myosin (y-axis) against utilized hC0-C2 (x-axis) in the assay was blotted for relative binding max (Bmax) and dissociation constant (Kd). Data were fit to the Michaelis–Menten binding fit, and statistical analyses were performed using an unpaired t-test. Error bars indicate ± S.E.M. (* p < 0.05). (B) Solid-phase binding analysis between human myosin S2 (hS2) recombinant proteins and hC0-C2WT as well as hS2 and hC0-C2D389V. Data were fit to the Michaelis–Menten binding fit, and statistical analyses were performed using an unpaired t-test to calculate the significance between the Kd values. n = 3 with replicates of three for each n value. Data are expressed as the mean ± S.E.M. (C) Isothermal calorimetry analysis showing the sigmoidal curve for the titration of hS2 to hC0-C2 yields the dissociation constant (1/slope) and stoichiometry of the reaction. Both hC0-C2WT and hC0-C2D389V were titrated against 350 µM hS2 recombinant proteins. Statistical analyses were performed using one-way ANOVA with Tukey’s multiple-comparison test and single pooled variance (n = 3). Data are expressed as the mean ± S.E.M. (D) Scatterplot of in vitro motility assay to measure the average velocity of actin thin filaments over human myosin HMM thick filaments in the absence (green) and the presence of hC0-C2WT (red) and hC0-C2D389V (blue) proteins. Statistical analyses were performed using one-way ANOVA with Tukey’s multiple-comparison test and single pooled variance (n = 3). Data are expressed as the mean ± S.E.M. (* p < 0.05).

Update of

Similar articles

References

    1. Semsarian C., Ingles J., Maron M.S., Maron B.J. New perspectives on the prevalence of hypertrophic cardiomyopathy. J. Am. Coll. Cardiol. 2015;65:1249–1254. doi: 10.1016/j.jacc.2015.01.019. - DOI - PubMed
    1. Kramer C.M., Appelbaum E., Desai M.Y., Desvigne-Nickens P., DiMarco J.P., Friedrich M.G., Geller N., Heckler S., Ho C.Y., Jerosch-Herold M., et al. Hypertrophic Cardiomyopathy Registry: The rationale and design of an international, observational study of hypertrophic cardiomyopathy. Am. Heart J. 2015;170:223–230. doi: 10.1016/j.ahj.2015.05.013. - DOI - PMC - PubMed
    1. Wolf C.M. Hypertrophic cardiomyopathy: Genetics and clinical perspectives. Cardiovasc. Diagn. Ther. 2019;9:S388–S415. doi: 10.21037/cdt.2019.02.01. - DOI - PMC - PubMed
    1. Marian A.J., Braunwald E. Hypertrophic Cardiomyopathy: Genetics, Pathogenesis, Clinical Manifestations, Diagnosis, and Therapy. Circ. Res. 2017;121:749–770. doi: 10.1161/CIRCRESAHA.117.311059. - DOI - PMC - PubMed
    1. Ramchand J., Fava A.M., Chetrit M., Desai M.Y. Advanced imaging for risk stratification of sudden death in hypertrophic cardiomyopathy. Heart. 2020;106:793–801. doi: 10.1136/heartjnl-2019-315176. - DOI - PubMed

MeSH terms

LinkOut - more resources