. 2024 Oct 20;25(20):11289.
doi: 10.3390/ijms252011289.

6-Gingerol Inhibits De Novo Lipogenesis by Targeting Stearoyl-CoA Desaturase to Alleviate Fructose-Induced Hepatic Steatosis

Affiliations

6-Gingerol Inhibits De Novo Lipogenesis by Targeting Stearoyl-CoA Desaturase to Alleviate Fructose-Induced Hepatic Steatosis

Pan Li et al. Int J Mol Sci. .

Abstract

Metabolic-associated fatty liver disease (MAFLD), also known as non-alcoholic fatty liver disease (NAFLD), is a worldwide liver disease without definitive or widely used therapeutic drugs in clinical practice. In this study, we confirm that 6-gingerol (6-G), an active ingredient of ginger (Zingiber officinale Roscoe) in traditional Chinese medicine (TCM), can alleviate fructose-induced hepatic steatosis. It was found that 6-G significantly decreased hyperlipidemia caused by high-fructose diets (HFD) in rats, and reversed the increase in hepatic de novo lipogenesis (DNL) and triglyceride (TG) levels induced by HFD, both in vivo and in vitro. Mechanistically, chemical proteomics and cellular thermal shift assay (CETSA)-proteomics approaches revealed that stearoyl-CoA desaturase (SCD) is a direct binding target of 6-G, which was confirmed by further CETSA assay and molecular docking. Meanwhile, it was found that 6-G could not alter SCD expression (in either mRNA or protein levels), but inhibited SCD activity (decreasing the desaturation levels of fatty acids) in HFD-fed rats. Furthermore, SCD deficiency mimicked the ability of 6-G to reduce lipid accumulation in HF-induced HepG2 cells, and impaired the improvement in hepatic steatosis brought about by 6-G treatment in HFD supplemented with oleic acid diet-induced SCD1 knockout mice. Taken together, our present study demonstrated that 6-G inhibits DNL by targeting SCD to alleviate fructose diet-induced hepatic steatosis.

Keywords: 6-gingerol; hepatic steatosis; metabolic-associated fatty liver disease; stearoyl-CoA desaturase; target.


Conflict of interest statement

The authors declare no conflicts of interest.

Figures

Figure 1
Figure 1
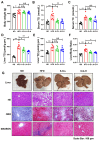
6-G reduces the lipid accumulation in HF-induced HepG2 cells. (A) MTT assay. (B) Cellular TG. (C) ORO staining of HepG2 cells. (D) ORO staining of cellular extract of HepG2 cells in DMSO. (E) OD intensity of the cellular extract with ORO staining at wavelength of 490 nm. 6-G-L: 5 μM 6-G; 6-G-M: 10 μM 6-G; 6-G-H: 20 μM 6-G. Data are expressed as mean ± SD, n = 3 independent experiments. ** p < 0.01.
Figure 2
Figure 2
6-G ameliorates metabolic syndrome and hepatic steatosis in HFD-induced disease in rats. (A) Body weight. (B) Serum TG. (C) Serum TC. (D) Liver TG. (E) Liver TC. (F) Ratio of liver/body weight in rats. (G) Liver pathology of rats, including liver images and HE, ORO, Masson staining. ND: normal diet; HFD: high-fructose diet; 6-G-L: 0.1 mg/kg; 6-G-H: 0.4 mg/kg. Data are expressed as mean ± SEM, n = 8 rats per group. ** p < 0.01, * p < 0.05. N.S: no significant differences.
Figure 3
Figure 3
6-G binds directly to SCD. (A) Differentially expressed proteins identified by CESTA-integrated quantitative proteomics analysis between 6-G and DMSO treatments. (B) Venn analysis of the targets identified by chemical proteomics and CETSA proteomics. (C) Efficiency evaluation of magnetic capture (chemical proteomics) by SDS-PAGE. The upper image displays Coomassie blue staining of SDS-PAGE while the lower image shows Western blot verification. Lane 1 represents the lysate of HF-induced HepG2 cells as a loading control, lane 2 exhibits the lysate captured by the functionalization of azide-MMs as a negative control, lane 3 indicates the lysate captured by the Al-6G-MMs. (D) CETSA assay for validation. The left panel shows SCD protein levels after heat treatment at different temperatures, the right panel shows SCD levels after treatment with different concentrations of 6-G at 55 °C. (E) Molecular docking. The left image exhibits the overall view for docking and the right image shows the detailed view. The yellow stick represents 6-G molecule, blue carton represents SCD protein, blue lines represent hydrogen bonding, and gray dashed lines stand for hydrophobic interactions. Data are expressed as mean ± STD, n = 3 independent experiments. ** p < 0.01, * p < 0.05.
Figure 4
Figure 4
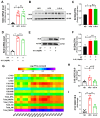
6-G suppresses SCD activity independently of SCD expression regulation. (A) Relative mRNA expression of SCD in rat livers. (B,C) SCD protein levels in rat livers. (D) SCD mRNA levels in HepG2 cells. (E,F) SCD protein expression in HepG2 cells. (G) Heatmap of the representative FFAs. FFAs: free fatty acids. (H,I) Ratios of C16:1N7/C16:0, C18:1N9/C18:0 in rat livers, showing SCD activity. Data are presented as mean ± SEM (in vivo, n ≥ 6/group) and mean ± STD (in vitro, n = 3 independent experiments). ** p < 0.01, * p < 0.05, N.S: no significant differences.
Figure 5
Figure 5
6-G alleviates SCD-mediated DNL and lipid accumulation in HF-induced HepG2 cells. (A,B) Knockdown efficiency of SCD at mRNA and protein levels by qRT-PCR and Western blot. (C) Relative expression of intracellular TG content to control (si-NC). (D) ORO staining. (E) Relative levels of intracellular free fatty acids to control. (F,G) Effect of SCD knockdown on AMPK and CPT1α levels, with or without 6-G treatment. siNC: blank siRNA, siSCD: knockdown of SCD by siRNA. Data are presented as mean ± STD, n = 3 independent experiments. ** p < 0.01, * p < 0.05, N.S: no significant differences.
Figure 6
Figure 6
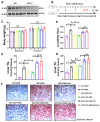
6-G improves fructose-induced hepatic steatosis of mice in a SCD1-dependent manner. (A) SCD1 expression in WT and SCD1−/− mice. (B) Scheme of mouse groupings and 6-G treatment. (C) Body weight of mice. (D) Ratio of liver/body weight. (E) Liver TG. (F) Liver ORO staining. (G) Liver TC. 6-G: 0.8 mg/kg. n ≥ 5 mice for each group. Data are expressed as mean ± SEM, ** p < 0.01, * p < 0.05, N.S: no significant differences.
Figure 7
Figure 7
Experimental procedures of chemical proteomics approach to identify the direct binding targets of 6-G. DMF: N, N-Dimethylformamide; Sulfo-SADP: sulfosuccinimidyl (4-azido-phenyldithio) propionate.
Figure 8
Figure 8
Technology roadmap of CETSA-integrated proteomics. Cell lysate was obtained from HF-induced HepG2 cells.

Similar articles

References

    1. Eslam M., Sanyal A.J., George J. MAFLD: A Consensus-Driven Proposed Nomenclature for Metabolic Associated Fatty Liver Disease. Gastroenterology. 2020;158:1999–2014. doi: 10.1053/j.gastro.2019.11.312. - DOI - PubMed
    1. Chen F., Esmaili S., Rogers G.B., Bugianesi E., Petta S., Marchesini G., Bayoumi A., Metwally M., Azardaryany M.K., Coulter S., et al. Lean NAFLD: A Distinct Entity Shaped by Differential Metabolic Adaptation. Hepatology. 2020;71:1213–1227. doi: 10.1002/hep.30908. - DOI - PubMed
    1. Fernando D.H., Forbes J.M., Angus P.W., Herath C.B. Development and Progression of Non-Alcoholic Fatty Liver Disease: The Role of Advanced Glycation End Products. Int. J. Mol. Sci. 2019;20:5037. doi: 10.3390/ijms20205037. - DOI - PMC - PubMed
    1. Davis T. Diabetes and metabolic dysfunction-associated fatty liver disease. Metabolism. 2021;123:154868. doi: 10.1016/j.metabol.2021.154868. - DOI - PubMed
    1. Uto Y. Recent progress in the discovery and development of stearoyl CoA desaturase inhibitors. Chem. Phys. Lipids. 2016;197:3–12. doi: 10.1016/j.chemphyslip.2015.08.018. - DOI - PubMed

MeSH terms

LinkOut - more resources