. 2024 Oct;9(10):2522-2537.
doi: 10.1038/s41564-024-01766-y. Epub 2024 Aug 1.

An acidophilic fungus promotes prey digestion in a carnivorous plant

Affiliations

An acidophilic fungus promotes prey digestion in a carnivorous plant

Pei-Feng Sun et al. Nat Microbiol. 2024 Oct.

Abstract

Leaves of the carnivorous sundew plants (Drosera spp.) secrete mucilage that hosts microorganisms, but whether this microbiota contributes to prey digestion is unclear. We identified the acidophilic fungus Acrodontium crateriforme as the dominant species in the mucilage microbial communities, thriving in multiple sundew species across the global range. The fungus grows and sporulates on sundew glands as its preferred acidic environment, and its presence in traps increased the prey digestion process. A. crateriforme has a reduced genome similar to other symbiotic fungi. During A. crateriforme-Drosera spatulata coexistence and digestion of prey insects, transcriptomes revealed significant gene co-option in both partners. Holobiont expression patterns during prey digestion further revealed synergistic effects in several gene families including fungal aspartic and sedolisin peptidases, facilitating prey digestion in leaves, as well as nutrient assimilation and jasmonate signalling pathway expression. This study establishes that botanical carnivory is defined by adaptations involving microbial partners and interspecies interactions.


Conflict of interest statement

The authors declare no competing interests.

Figures
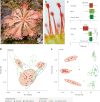
Fig. 1
Fig. 1. Microbial communities of D. spatulata mucilage and surrounding co-occurring plants.
a, D. spatulata. b, Close-up of stalk glands with secreted mucilage. c, Bacterial and fungal species evenness in sundew mucilage (n = 44) versus those of co-occurring moss (n = 24) and vascular plant leaf surfaces (n = 24). Asterisks denote significant difference from Wilcoxon rank sum test (two sided with multiple testing, ****adjusted P < 0.0001; mucilage versus vascular plant, P = 1.80 × 10−8; mucilage versus moss, P = 1.79 × 10−7). The centre line represents the median, and the upper and lower bounds of the box represent the 25th and 75th percentiles, respectively. The whiskers extend to 1.5 times the interquartile range (i.q.r.). d,e, Beta diversity (Bray–Curtis index) of bacterial (d) and fungal (e) communities from three sites (Supplementary Fig. 2). Ellipses were drawn at 95% confidence level within samples of the same plant source and site. PC1, principal component 1; PC2, principal component 2. Source data
Fig. 2
Fig. 2. Abundance of Acrodontium OTU in Drosera mucilage.
a, Relative abundances of the ten most abundant bacterial and fungal taxa among mucilage of D. spatulata (n = 44) and surrounding plants (moss, n = 24, and vascular plants, n = 24), highlighting A. crateriforme as the dominant species in the mucilage. Unpaired t-test was conducted (two sided, *P < 0.05; **P < 0.01; ***P < 0.001; ****P < 0.0001). The centre line represents the median, and the upper and lower bounds of the box represent the 25th and 75th percentiles, respectively. The whiskers extend to 1.5 times the i.q.r. b, Temporal variation of Acrodontium and the next four most abundant OTUs shown as relative abundance in mucilage over 9 months (n = 4) between 2018 and 2019 pooled from Shumei and Shuangxi in northern Taiwan (Supplementary Fig. 2). Data are presented as mean ± s.d. c, Relative abundance of A. crateriforme identified from ITS amplicons from mucilage or tissues of four Drosera species sampled across northern Taiwan, North America and the United Kingdom. Source data
Fig. 3
Fig. 3. The A. crateriformeD. spatulata holobiont.
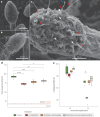
ac, SEM image of sundew stalk glands under sterile lab conditions (a), inoculated with A. crateriforme (b) and from wild samples from the natural habitat (c). Each condition was repeated once and images were retaken with similar results. Different arrow colours denote fungal conidiophores from which conidia were already detached (red), a conidium attached to the tip of a conidiophore (blue) and detached conidia (white). d, Reopening time of sundew traps with and without (control) supplementation with different substrates, or with inoculation with different microbiota. Each set contains a single leaf from five individual plants. The centre line represents the median, and the upper and lower bounds of the box represent the 25th and 75th percentiles, respectively. The whiskers extend to 1.5 times the i.q.r. Median reopening time for touch, shrimp and wood in sundews with different microbiota are plotted as dashed lines (Extended Data Fig. 5). Unpaired two-tailed t-tests with multiple testing were performed (*P < 0.05; **P < 0.01; ***P < 0.001; ****P < 0.0001). e, Application of biotin-labelled BSA as a protein substrate during 16 h and 24 h of sundew digestion showing a decline in BSA with digestion using collected mucilage from sundews inoculated with different inocula. Each set contains five samples of pooled mucilage from a single sundew or entire wiped leaf surfaces of a single adjacent plant. Raw western blot images are shown in Supplementary Fig. 22. The centre line represents the median, and the upper and lower bounds of the box represent the 25th and 75th percentiles, respectively. The whiskers extend to 1.5 times the i.q.r. Wilcoxon rank sum test with multiple testing was conducted (*P < 0.05). Source data
Fig. 4
Fig. 4. Genomic features of A. crateriforme.
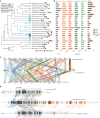
a, Phylogenetic placement of A. crateriforme among extremophilic fungi denoted in blue branches, highlighting its association with known acidophiles. All nodes have a 100% bootstrap support. The number next to A. crateriforme denotes the number of lost OGs inferred by DOLLOP. b, Genome description and functional annotations of the A. crateriforme proteome. DHN, dihydroxynaphthalene; NRPs, nonribosomal peptides; RiPP, ribosomally synthesised and post-translationally modified peptides. c, Chromosomal rearrangements among extremophile fungi A. crateriforme, Baudoinia panamericana and H. werneckii through clustering of single-copy orthologue pairs. The line colours designate corresponding A. crateriforme chromosomes. d, Synteny between a subtelomeric polyketide cluster on A. crateriforme chromosome 6 and plant pathogens E. ampelina and P. nodorum. A. crateriforme genes and orthologues are coloured sequentially. Source data
Fig. 5
Fig. 5. Transcriptome of the D. spatulataA. crateriforme holobiont during digestion.
a, Overlap of upregulated (up) or downregulated (down) DEGs during digestion and coexistence for both species compared with baseline controls (determined by DESeq2; |log2(fold change)| > 1 and adjusted P < 0.05). Percentages indicate the proportion of differentially expressed genes in the digestion phase that were also expressed in the same trend in the coexistence phase. b, Transcriptome profiling of the plant–fungus holobiont during digestion with the fungus on the right and the plant on the left. DEGs were compared whether the same trends were observed in either the digestion or the coexistence process. c, Schematic representation of the role of the DEGs involved in the holobiont digestion. d, Schematic representation of designated categories of DEGs in c when compared with transcriptome changes in the plant treated with chitin or dead fungus. Numbers in rectangles denote the number of genes. NS denotes not significant, that is, DEGs that did not exhibit expression changes in response to elicitors. Numbers in brackets denote the proportion of DEGs that were also expressed in the same trend when the plant was treated with different elicitors. e, Expression of representative fungal peptidases in a co-expression module (module 2 in Supplementary Fig. 16) showing synergistic effects when both plant and insect prey are present. Asterisks indicate significantly upregulated expression between holobiont digestion and either the digestion or the coexistence phase. tpm, transcript per million. Source data
Fig. 6
Fig. 6. Interactions within the D. spatulataA. crateriforme holobiont.
A schematic diagram of a D. spatulata stalk gland and an A. crateriforme conidiophore with a summary of gene expression changes identified in this study. Genes that are co-expressed in different phases are shown multiple times.
Extended Data Fig. 1
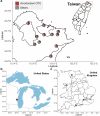
Extended Data Fig. 1. Abundance and spatial distribution of Acrodontium crateriforme in a. Taiwan, b. USA and c. UK.
Pie chart denote relative abundance of fungal OTUs. Source data
Extended Data Fig. 2
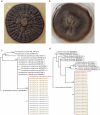
Extended Data Fig. 2. ITS phylogeny of Acrodontium crateriforme and Phoma herbarum.
Photo shows the morphology of a. A. crateriforme and b. P. herbarum grown in potato dextrose agar. Red colour represents the consensus sequence of the c. Acrodontium and d. Phoma OTU from amplicon data. Brown colour represent sequences of strains that were isolated from Drosera spatulata mucilage.
Extended Data Fig. 3
Extended Data Fig. 3. Scanning electron microscope (SEM) image of Drosera spatulata sundew leaves.
a-c. laboratory material grown under sterile, axenic conditions without fungi or bacteria, d-f. laboratory materials inoculated with A. crateriforme fungus, and g-i. collected from wild. Each condition was repeated once and images were re-taken with similar results.
Extended Data Fig. 4
Extended Data Fig. 4. Infected areas of D. spatulata one month after post-inoculation with A. crateriforme or Ph. herbarum.
a. Each set consist of wilted area calculated from 10 plants (Wilcoxon rank sum test; two sided, *P < 0.05. **P < 0.01, ***P < 0.001). Data are presented as mean values ± SD. b. A photo showing wilt of D. spatulata as a result of inoculating Ph. herbarum. Source data
Extended Data Fig. 5
Extended Data Fig. 5. Re-opening time of sundew traps grown one month after different inoculum and fed with different substrates/stimulation.
a. Treatment without proteinase inhibitor. b. Treatment with proteinase inhibitor. Asterisk denote P values from Wilcoxon-rank sum test (two sided, * P<0.05, ** P<0.01, *** P<0.001). + and – denote presence and absence of treatment, respectively. The centre line represents the median, with the upper and lower bounds of the box representing the 25th and 75th percentiles, respectively. The whiskers extend to 1.5 × i.q.r. Source data
Extended Data Fig. 6
Extended Data Fig. 6. Another two batches (a. and b.) of digestion experiment.
Application of biotin-labelled BSA as a protein substrate during 16 and 24 h of sundew digestion using collected mucilage from sundews inoculated with different inoculum. (a: n=3, b: n=5, biological measurements; Wilcoxon rank sum test with multiple testing; two sided, * adjusted P<0.05.) The centre line represents the median, with the upper and lower bounds of the box representing the 25th and 75th percentiles, respectively. The whiskers extend to 1.5 × i.q.r. Source data
Extended Data Fig. 7
Extended Data Fig. 7. Acrodontium phylogeny with orthogroup (OG) losses and gene number.
The blue circles on phylogeny described the loss OG number at each node. The heatmaps showed gene numbers of OGs in representative species. A. crateriforme was inferred to loss these OGs. Source data
Extended Data Fig. 8
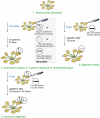
Extended Data Fig. 8. Schematic diagram of different treatments used in the experiment for RNAseq.
Green numbers and letters denote different treatments and transcriptome comparisons. Blue letters denote treatment. Details of preparation of sterile plants and incubation after inoculation are shown in Methods and Supplementary Methods.
Extended Data Fig. 9
Extended Data Fig. 9. Fungal growth on remains of dead arthropod (covered by evenly spread hairs) on wild Drosera spatulata.
Fungal hyphae indicated by white arrowheads, two conidiophores of Acrodontium crateriforme by red arrows.

Similar articles

References

    1. Freund, M. et al. The digestive systems of carnivorous plants. Plant Physiol.190, 44–59 (2022). - PMC - PubMed
    1. Darwin, C. & Darwin, F. Insectivorous Plants (J. Murray, 1888).
    1. Alessandri, G., Rizzo, S. M., Ossiprandi, M. C., van Sinderen, D. & Ventura, M. Creating an atlas to visualize the biodiversity of the mammalian gut microbiota. Curr. Opin. Biotechnol.73, 28–33 (2022). - PubMed
    1. Sirová, D. et al. Microbial community development in the traps of aquatic Utricularia species. Aquat. Bot.90, 129–136 (2009).
    1. Takeuchi, Y. et al. Bacterial diversity and composition in the fluid of pitcher plants of the genus Nepenthes. Syst. Appl. Microbiol.38, 330–339 (2015). - PubMed

LinkOut - more resources