. 2024 Jul 24;90(7):e0039424.
doi: 10.1128/aem.00394-24. Epub 2024 Jun 25.

Arthropod prey type drives decomposition rates and microbial community processes

Affiliations

Arthropod prey type drives decomposition rates and microbial community processes

Jessica R Bernardin et al. Appl Environ Microbiol. .

Abstract

Microbial communities perform various functions, many of which contribute to ecosystem-level nutrient cycling via decomposition. Factors influencing leaf detrital decomposition are well understood in terrestrial and aquatic ecosystems, but much less is known about arthropod detrital inputs. Here, we sought to infer how differences in arthropod detritus affect microbial-driven decomposition and community function in a carnivorous pitcher plant, Sarracenia purpurea. Using sterile mesh bags filled with different types of sterile arthropod prey, we assessed if prey type influenced the rate of decomposition in pitcher plants over 7 weeks. Additionally, we measured microbial community composition and function, including hydrolytic enzyme activity and carbon substrate use. When comparing decomposition rates, we found that ant and beetle prey with higher exoskeleton content lost less mass compared with fly prey. We observed the highest protease activity in the fly treatment, which had the lowest exoskeleton content. Additionally, we saw differences in the pH of the pitcher fluid, driven by the ant treatment which had the lowest pH. According to our results from 16S rRNA gene metabarcoding, prey treatments with the highest bacterial amplicon sequence variant (ASV) richness (ant and beetle) were associated with prey that lost a lower proportion of mass over the 7 weeks. Overall, arthropod detritus provides unique nutrient sources to decomposer communities, with different prey influencing microbial hydrolytic enzyme activity and composition.

Importance: Microbial communities play pivotal roles in nutrient cycling via decomposition and nutrient transformation; however, it is often unclear how different substrates influence microbial activity and community composition. Our study highlights how different types of insects influence decomposition and, in turn, microbial composition and function. We use the aquatic pools found in a carnivorous pitcher plant as small, discrete ecosystems that we can manipulate and study independently. We find that some insect prey (flies) breaks down faster than others (beetles or ants) likely because flies contain more things that are easy for microbes to eat and derive essential nutrients from. This is also reflected in higher enzyme activity in the microbes decomposing the flies. Our work bridges a knowledge gap about how different substrates affect microbial decomposition, contributing to the broader understanding of ecosystem function in a nutrient cycling context.

Keywords: Sarracenia; bacterial function; decomposition; hydrolytic enzyme activity; microbial communities; pitcher plant.


Conflict of interest statement

The authors declare no conflict of interest.

Figures

Fig 1
Fig 1
A schematic figure illustrating the experimental design and nutritional differences in insect prey. (A) Seven unopened pitchers were selected from each of five plant blocks in a high-altitude Swiss bog. (B) At day 0, prey bags were added to each pitcher (one replicate of each treatment per block) and pitchers were covered with a fine mesh prey exclusion bag (except for positive control, not shown). (C) We characterized nutrient composition for the single-species prey (ants, beetles, and flies). Flies had the highest proportion of lipid content and the lowest exoskeleton content, whereas beetles and ants had the highest exoskeleton content.
Fig 2
Fig 2
Prey decomposition rates depend on prey type. (A) The proportion of mass lost over 7 weeks for the different types of insect prey inside mesh bags. The colored points represent individual samples, and the black points represent the estimated marginal effects along with 95% credibility intervals for each estimate. (B) The posterior estimate of the proportion of mass lost for fly prey bags. (C) The posterior estimates of the proportion of mass lost for each treatment compared with fly (baseline, 0). The points represent the median estimate, and the black bars represent the 95% credibility intervals around those estimates.
Fig 3
Fig 3
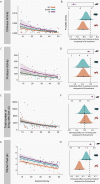
Microbial functioning across prey treatments. For the left-hand panels, the points show the measures of each variable from each pitcher through sampling time, and the line represents the median marginal effects and 95% credibility intervals over time. The right-hand panels show the corresponding posterior density estimates, with estimates in the black boxes representing the model intercept (fly prey), which is the baseline estimate (0) to which the parameter estimates are compared. In all cases, the black point represents the median estimated effect compared with the baseline with all other parameters held at their means, the black bar represents the 95% credibility intervals, and the density plot shows the distribution of the posterior draws. The x-axes represent values calculated from the log link function. (A) Chitinase activity (µg substrate/min) measured for each pitcher fluid sample weekly from day 7 to day 49. (B) Posterior density estimates of prey type on chitinase rate. (C) Protease activity (ng substrate/min) measured for each pitcher fluid sample weekly from day 7 to day 49. (D) Posterior density estimates of prey type on protease rate. (E) Bacterial living biomass (living bacterial cells per µL pitcher fluid) measured for each pitcher fluid sample weekly from day 7 to day 49. (F) Posterior density estimates of prey type on living cells. (G) Pitcher fluid pH measured for each pitcher fluid sample weekly from day 7 to day 49. (H) Posterior density estimates of prey type on pitcher fluid pH.
Fig 4
Fig 4
Carbon substrate use for ant, beetle, and fly prey treatments. (A) Non-metric multidimensional scaling (NMDS) of Bray-Curtis dissimilarities between carbon substrate used for microbial samples across ant, beetle, and fly prey treatments at four time points (k = 2, stress = 0.16), colored by treatment (PERMANOVA; R2 = 0.07801, F4,87=2.4858, P = 0.003) and time (PERMANOVA; R2 = 0.24018, F3,87=10.2045, P = 0.001). (B) Four carbon substrates showed statistically different carbon substrate metabolism between at least two of the three prey treatments. Point represents the estimated marginal effect of substrate on absorbance, and the vertical bar represents the 95% credibility intervals around each estimate.
Fig 5
Fig 5
Microbial composition between the ant, beetle, and fly treatments. (A) ASV richness across days 7, 14, and 35 for the three prey treatments. (B) Posterior probability estimates for ASV richness based on treatment and time. The black point is the median estimate, and the black bars represent the 95% credibility intervals (based on a GLM with a negative binomial distribution). (C, D) Non-metric multidimensional scaling (NMDS) of unweighted UniFrac distances for microbial samples across ant, beetle, and fly prey treatments at three time points (k = 2, stress = 0.16), colored by treatment [C, PERMANOVA Df2,37, R2 = 0.22, P < 0.001)] and time (D). (E) Seven differentially abundant ASVs (subset from the 13 taxa identified) at days 7, 14, and 35. Reads were transformed by log2(0.5 + reads), both ASV number and genus name are listed on the x-axis. In all cases, boxplots represent the interquartile range (IQR) of the counts for each sample in each treatment, and the whiskers extend 1.5 times the IQR, with the horizontal bars representing the medians.
Fig 6
Fig 6
Local versus non-local prey show very similar trends. (A) The proportion of mass lost for the different arthropod prey over 7 weeks in planta. (B) Bacterial richness in pitcher fluid that had local vs non-local prey at day 7, day 14, and day 35. For (A and B), boxplots represent the IQR of the values for each sample in each treatment, and the whiskers extend 1.5 times the IQR, with the horizontal bars representing the medians, and points being the sample values. (C) Nonmetric multidimensional scaling (NMDS) of unweighted UniFrac distances for microbial samples across local and non-local prey treatments at three time points (k = 2, stress = 0.116), colored by treatment (PERMANOVA Df1,23, R2 = 0.088, P = 0.045).
Fig 7
Fig 7
A conceptual model for arthropod digestion in the pitcher plant system. Arthropod type influences the pH of pitcher fluid. Easy-to-metabolize substrates like carbohydrates (sugars) are consumed first, helping to establish a growing microbial community. Then, microbes produce hydrolytic enzymes that transform proteins and lipids into more bioavailable sources of nitrogen that become a common good for other members of the microbial community and the pitcher plant. Lastly, chitin, which is more recalcitrant, offers an important source of nitrogen to the system at the end of the decomposition process.

Similar articles

References

    1. Nemergut DR, Cleveland CC, Wieder WR, Washenberger CL, Townsend AR. 2010. Plot-scale manipulations of organic matter inputs to soils correlate with shifts in microbial community composition in a lowland tropical rain forest. Soil Biol Biochem 42:2153–2160. doi:10.1016/j.soilbio.2010.08.011 - DOI
    1. Craig ME, Geyer KM, Beidler KV, Brzostek ER, Frey SD, Stuart Grandy A, Liang C, Phillips RP. 2022. Fast-decaying plant litter enhances soil carbon in temperate forests but not through microbial physiological traits. Nat Commun 13:1229. doi:10.1038/s41467-022-28715-9 - DOI - PMC - PubMed
    1. Burns RG, Dick RP. 2002. Enzymes in the environment: activity, ecology, and applications. CRC Press.
    1. Bhatnagar JM, Peay KG, Treseder KK. 2018. Litter chemistry influences decomposition through activity of specific microbial functional guilds. Ecol Monogr 88:429–444. doi:10.1002/ecm.1303 - DOI
    1. Pereira A, Ferreira V. 2021. Invasion of native riparian forests by acacia species affects in-stream litter decomposition and associated microbial decomposers. Microb Ecol 81:14–25. doi:10.1007/s00248-020-01552-3 - DOI - PubMed

Publication types

Substances

LinkOut - more resources