Exploring the Molecular Mechanisms and Shared Gene Signatures Between Systemic Lupus Erythematosus and Bladder Urothelial Carcinoma
- PMID: 38435117
- PMCID: PMC10909332
- DOI: 10.2147/IJGM.S448720
Exploring the Molecular Mechanisms and Shared Gene Signatures Between Systemic Lupus Erythematosus and Bladder Urothelial Carcinoma
Abstract
Background: Systemic lupus erythematosus (SLE) is a chronic autoimmune disease associated with increased susceptibility to cancer, including bladder urothelial carcinoma (BLCA). This study investigates the shared molecular mechanisms and gene signatures between SLE and BLCA, shedding light on potential biomarkers and therapeutic targets.
Methods: We compiled gene datasets related to SLE and BLCA from various databases and identified common genes. Differential gene expression analysis, protein-protein interaction networks, and hub gene identification were performed. We studied functional enrichment, immune infiltration, and transcription factor/miRNA regulation networks. We also explored gene-disease interactions and protein-chemical/drug networks. Hub gene expression levels and diagnostic values were validated in TCGA and GEO databases. Prognostic analysis was performed on the core gene MMP9 in the TCGA-BLCA database to study its prognostic value. Finally, the mRNA expression of MMP9 was verified in bladder cancer cell lines and BLCA patient blood. The diagnostic value of MMP9 for BLCA was verified by receiver operating characteristic(ROC) curve analysis of the expression of MMP9 in patients' blood.
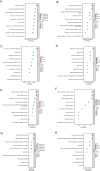
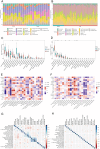
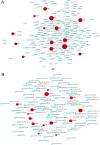
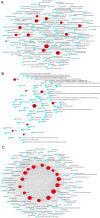
Results: We identified 524 common genes between SLE and BLCA, enriched in pathways related to apoptosis and cytokine regulation. Immune infiltration analysis for two diseases. Transcription factors and microRNAs were implicated in regulating these common genes. The gene-disease network linked hub genes with various diseases, emphasizing their roles in autoimmune disease and cancer. Protein-chemical/drug networks highlighted potential treatment options. Finally, our study found that MMP9 is a potential therapeutic target with diagnostic and prognostic value and Immune-related biomarkers in patients with BLCA and SLE.
Conclusion: Our study reveals shared molecular mechanisms, genetic signatures, and immune infiltrates between SLE and BLCA. MMP9 emerges as a potential diagnostic and prognostic biomarker in BLCA, warranting further investigation. These findings provide insights into the pathogenesis of SLE-associated BLCA and may guide future research and therapeutic strategies.
Keywords: MMP9; bladder urothelial carcinoma; gene signatures; immune response; systemic lupus erythematosus.
© 2024 Wang et al.
Conflict of interest statement
The authors declare no competing interest in this work.
Figures


Similar articles
-
Exploring the Shared Gene Signatures and Molecular Mechanisms between Bladder Urothelial Carcinoma and Metabolic Syndrome.Arch Esp Urol. 2023 Oct;76(8):605-621. doi: 10.56434/j.arch.esp.urol.20237608.75. Arch Esp Urol. 2023. PMID: 37960960
-
Identification of Diagnostic Gene Markers and Immune Infiltration in Systemic Lupus.Comput Math Methods Med. 2022 May 10;2022:3386999. doi: 10.1155/2022/3386999. eCollection 2022. Comput Math Methods Med. 2022. Retraction in: Comput Math Methods Med. 2023 Dec 6;2023:9862513. doi: 10.1155/2023/9862513. PMID: 35558576 Free PMC article. Retracted.
-
Development and validation of a model based on immunogenic cell death related genes to predict the prognosis and immune response to bladder urothelial carcinoma.Front Oncol. 2023 Nov 10;13:1291720. doi: 10.3389/fonc.2023.1291720. eCollection 2023. Front Oncol. 2023. PMID: 38023241 Free PMC article.
-
Global analysis of miRNA-mRNA regulation pair in bladder cancer.World J Surg Oncol. 2022 Mar 3;20(1):66. doi: 10.1186/s12957-022-02538-w. World J Surg Oncol. 2022. PMID: 35241117 Free PMC article.
-
MicroRNAs: Their Role in Metastasis, Angiogenesis, and the Potential for Biomarker Utility in Bladder Carcinomas.Cancers (Basel). 2021 Feb 20;13(4):891. doi: 10.3390/cancers13040891. Cancers (Basel). 2021. PMID: 33672684 Free PMC article. Review.
References
LinkOut - more resources
Full Text Sources
Miscellaneous

