A randomized, placebo-controlled phase 3 trial of the PI3Kδ inhibitor leniolisib for activated PI3Kδ syndrome
- PMID: 36399712
- PMCID: PMC10163280
- DOI: 10.1182/blood.2022018546
A randomized, placebo-controlled phase 3 trial of the PI3Kδ inhibitor leniolisib for activated PI3Kδ syndrome
Abstract
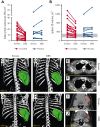
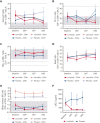
Activated phosphoinositide 3-kinase delta (PI3Kδ) syndrome (APDS) is an inborn error of immunity with clinical manifestations including infections, lymphoproliferation, autoimmunity, enteropathy, bronchiectasis, increased risk of lymphoma, and early mortality. Hyperactive PI3Kδ signaling causes APDS and is selectively targeted with leniolisib, an oral, small molecule inhibitor of PI3Kδ. Here, 31 patients with APDS aged ≥12 years were enrolled in a global, phase 3, triple-blinded trial and randomized 2:1 to receive 70 mg leniolisib or placebo twice daily for 12 weeks. Coprimary outcomes were differences from baseline in the index lymph node size and the percentage of naïve B cells in peripheral blood, assessed as proxies for immune dysregulation and deficiency. Both primary outcomes were met: the difference in the adjusted mean change (95% confidence interval [CI]) between leniolisib and placebo for lymph node size was -0.25 (-0.38, -0.12; P = .0006; N = 26) and for percentage of naïve B cells, was 37.30 (24.06, 50.54; P = .0002; N = 13). Leniolisib reduced spleen volume compared with placebo (adjusted mean difference in 3-dimensional volume [cm3], -186; 95% CI, -297 to -76.2; P = .0020) and improved key immune cell subsets. Fewer patients receiving leniolisib reported study treatment-related adverse events (AEs; mostly grades 1-2) than those receiving placebo (23.8% vs 30.0%). Overall, leniolisib was well tolerated and significant improvement over placebo was notable in the coprimary endpoints, reducing lymphadenopathy and increasing the percentage of naïve B cells, reflecting a favorable impact on the immune dysregulation and deficiency seen in patients with APDS. This trial was registered at www.clinicaltrials.gov as #NCT02435173.
© 2023 by The American Society of Hematology. Licensed under Creative Commons Attribution-NonCommercial-NoDerivatives 4.0 International (CC BY-NC-ND 4.0), permitting only noncommercial, nonderivative use with attribution. All other rights reserved.
Conflict of interest statement
Conflict-of-interest disclosure: A. Šedivá is a consult for Octapharma, Takeda, and Pharming Group NV. A. Shcherbina receives honoraria from and is a consult for Octapharma, CSL Behring, and Novartis AG. E.K. is an employee of Leidos Biomedical Research, Inc. V.A.D. is a consultant for and/or receives honoraria from AstraZeneca, Kedrion, Takeda, CSL Behring, Pfizer, and Pharming Group NV. V.A.D. also receives honoraria from Pfizer, and research funding from Takeda. K.K. is an employee and shareholder of Novartis Pharma AG. K.R. is an employee of Novartis Pharma AG. A.R. and J.B. are current employees and stock option holders of Pharming Group NV, and J.B. holds individual stock in NeoClone. The remaining authors declare no competing financial interests.
Figures


Comment in
-
PI3king apart a rare disease with targeted therapy.Blood. 2023 Mar 2;141(9):963-964. doi: 10.1182/blood.2022019105. Blood. 2023. PMID: 36862438 No abstract available.
Similar articles
-
Effective "activated PI3Kδ syndrome"-targeted therapy with the PI3Kδ inhibitor leniolisib.Blood. 2017 Nov 23;130(21):2307-2316. doi: 10.1182/blood-2017-08-801191. Epub 2017 Sep 29. Blood. 2017. PMID: 28972011 Free PMC article.
-
Long-term treatment with selective PI3Kδ inhibitor leniolisib in adults with activated PI3Kδ syndrome.Blood Adv. 2024 Jun 25;8(12):3092-3108. doi: 10.1182/bloodadvances.2023011000. Blood Adv. 2024. PMID: 38593221 Free PMC article.
-
APDS patients with immune-complex vasculitis and resolution with leniolisib.Clin Immunol. 2024 May;262:110176. doi: 10.1016/j.clim.2024.110176. Epub 2024 Mar 8. Clin Immunol. 2024. PMID: 38462154
-
Leniolisib: First Approval.Drugs. 2023 Jul;83(10):943-948. doi: 10.1007/s40265-023-01895-4. Drugs. 2023. PMID: 37256490 Review.
-
Modulating the PI3K Signalling Pathway in Activated PI3K Delta Syndrome: a Clinical Perspective.J Clin Immunol. 2023 Dec 27;44(1):34. doi: 10.1007/s10875-023-01626-0. J Clin Immunol. 2023. PMID: 38148368 Free PMC article. Review.
Cited by
-
Leniolisib: a drug providing a promising avenue for the treatment of activated phosphoinositide 3-kinase δ syndrome (APDS).Ann Med Surg (Lond). 2024 May 20;86(7):3812-3813. doi: 10.1097/MS9.0000000000002189. eCollection 2024 Jul. Ann Med Surg (Lond). 2024. PMID: 38989184 Free PMC article. No abstract available.
-
Too much of a good thing: a review of primary immune regulatory disorders.Front Immunol. 2023 Oct 31;14:1279201. doi: 10.3389/fimmu.2023.1279201. eCollection 2023. Front Immunol. 2023. PMID: 38022498 Free PMC article. Review.
-
BMPR2 Loss Activates AKT by Disrupting DLL4/NOTCH1 and PPARγ Signaling in Pulmonary Arterial Hypertension.Int J Mol Sci. 2024 May 15;25(10):5403. doi: 10.3390/ijms25105403. Int J Mol Sci. 2024. PMID: 38791441 Free PMC article.
-
Monogenic Inborn Errors of Immunity with impaired IgG response to polysaccharide antigens but normal IgG levels and normal IgG response to protein antigens.Front Pediatr. 2024 Jun 12;12:1386959. doi: 10.3389/fped.2024.1386959. eCollection 2024. Front Pediatr. 2024. PMID: 38933494 Free PMC article. Review.
-
Monogenic forms of common variable immunodeficiency and implications on target therapeutic approaches.Curr Opin Allergy Clin Immunol. 2023 Dec 1;23(6):461-466. doi: 10.1097/ACI.0000000000000947. Epub 2023 Sep 28. Curr Opin Allergy Clin Immunol. 2023. PMID: 37767915 Free PMC article. Review.
References
-
- Nunes-Santos CJ, Uzel G, Rosenzweig SD. PI3K pathway defects leading to immunodeficiency and immune dysregulation. J Allergy Clin Immunol. 2019;143(5):1676–1687. - PubMed
Publication types
MeSH terms
Substances
Associated data
LinkOut - more resources
Full Text Sources
Miscellaneous

