. 2022 Jun;19(191):20220018.
doi: 10.1098/rsif.2022.0018. Epub 2022 Jun 1.

Unicellular-multicellular evolutionary branching driven by resource limitations

Affiliations

Unicellular-multicellular evolutionary branching driven by resource limitations

Adriano Bonforti et al. J R Soc Interface. 2022 Jun.

Abstract

Multicellular life forms have evolved many times on our planet, suggesting that this is a common evolutionary innovation. Multiple advantages have been proposed for the emergence of multicellularity (MC). In this paper, we address the problem of how the first precondition for MC, namely 'stay together', might have occurred under spatially limited resources exploited by a population of unicellular agents. Using a minimal model of evolved cell-cell adhesion among growing and dividing cells that exploit a localized resource with a given size, we show that a transition occurs at a critical resource size separating a phase of evolved multicellular aggregates from a phase where unicellularity (UC) is favoured. The two phases are separated by an intermediate domain where both UC and MC can be selected by evolution. This model provides a minimal approach to the early stages that were required to transition from individuality to cohesive groups of cells associated with a physical cooperative effect: when resources are present only in a localized portion of the habitat, MC is a desirable property as it helps cells to keep close to the available local nutrients.

Keywords: cell adhesion; evolutionary preconditions; evolutionary transitions; multicellularity; statistical physics.


Figures

Figure 1.
Figure 1.
Cell adhesion and its lattice modelling counterpart. (a) Interactions among cells carrying adhesion molecules (such as cadherins) can involve homologous (HOM) or heterologous (HET), depending on when the molecules are the same or different, respectively [14,15]. The microscopic details (b) of the physical exchanges between cell adhesion molecules (CAM) can be captured by simple physical models where the energy E associated with cell–cell interactions is displayed in (c) against cell–cell distance D. A minimum energy E0 is associated with a given characteristic scale rb that would define the equilibrium distance between cells [16,17]. Such energy function (and the underlying forces associated with it) are replaced in this paper by a simple toy model where pairwise interactions are defined by means of a simple coupling coefficient Jkr (d) that weights the strength of the interaction between cells k and f. In this simple way we take into account the heterogeneous nature of evolved CAM and the impact of heterogeneous adhesion [18]. The spatial dynamics of the in silico cells on the Ω lattice occurs in parallel with the production, decay and continuous diffusion of resources. Different resource abundances (R1 and R2) favour the evolution of two main types of behaviour (e), namely unicellular (UC) and multicellular (MC). Interactions occur among nearest neighbours (c) on the 3 × 3 (Moore) neighbourhood (f).
Figure 2.
Figure 2.
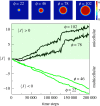
Evolution of adhesion (population-level average) for different sizes of the central nutrient disc (colour bar scale is in ×10−2 a.u.). For small resource sizes (ϕ < ϕc), the adhesion parameter J evolves towards multicellularity (i.e. adhesion, J < 0), whereas for larger resources unicellularity (repulsion) is selected (J > 0). On top we show the corresponding resource spatial snapshots associated with each of the four evolution experiments.
Figure 3.
Figure 3.
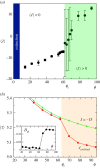
(a) Transitions from multi- to unicellularity, as displayed by the values of average adhesion 〈J〉 against ϕ, by averaging over 10 replicas of each evolutionary experiment. Error bars indicate the standard deviation. See electronic supplementary material, figure S2, for a comparison of this result with the same transition in a more relaxed model without active repulsion. (b) The average cell reproduction time 〈τ〉 against resource size. Here the evolved values of 〈J〉 are compared with the expected results for a fixed J = −15 value associated with multicellular aggregates. A marked divergence occurs close to ϕc as unicellularity is chosen, allowing for faster replication. The difference between both curves is shown in the inset.
Figure 4.
Figure 4.
In (a) we plot, for different diameters, the average fraction 〈Nψ〉 of the population occupying the resource disc Ψ against the adhesion parameter J. We normalize to one the maximum value of 〈Nψ〉 for each diameter, using 〈Nψ〉 + (1 − 〈Nψmax). MC behaviour (J < 0) allows a better occupation of the disc. In the UC range (J > 0) 〈Nψ〉 decreases, with a steep transition for J ∼ 0. Note that the distance between 〈Nψmax and 〈Nψmin decreases as the diameter ϕ of the resource disc increases, indicating that the impact of evolving MC instead of UC behaviour becomes less relevant as ϕ increases. In the inset, we show the same effect, using as a measure the standard deviation of all the data points of each plot with fixed diameter ϕ. One last note on the normalization procedure: the non-normalized value of 〈Nψmax varies for each ϕ; in particular, the larger ϕ, the larger 〈Nψmax (see electronic supplementary material, figure S1). In (b) we show, for different diameters, the average reproduction time of cells against the adhesion parameter J. UC provides an advantage (faster reproduction) over MC. Note that for larger values of ϕ the reproduction time decreases for J < 0 (MC behaviour), indicating also here that the impact of evolving MC instead of UC behaviour becomes less relevant as the size of nutrient disc Ψ increases. In the inset, we show that the standard deviation σ among all data points of each plot with fixed ϕ becomes smaller as the size of the nutrient disc Ψ increases. The results shown in both (a) and (b) represent an average over four replicas for each value of ϕ. Even if the error bars are too small to be shown on the plot, they are substantially smaller than the differences between the values for J < 0 and J > 0 for both (a) and (b), indicating that these differences are statistically relevant.
Figure 5.
Figure 5.
Evolutionary branching under resource constraints. Three different examples of the evolutionary patterns displayed by the evolved adhesion model for three different resource sizes. For sub-critical ϕ only one branch is found, associated with the emergence of multicellular ensembles (i.e. evolving towards negative values of J), as exemplified in (a). For super-critical ϕ multiple branches are always found, with cells on the periphery Ψ evolving adhesion, while those within ϕ display repulsion, as exemplified in (b). Here an arms race between the two kinds of phenotype can be seen. In the critical domain (ϕϕc), the system can evolve indifferently towards the MC-only phase that is typical of sub-critical ϕ (a) or towards the UC–MC phase that is typical of super-critical ϕ (b). In (c) we show that, as the diameter ϕ of the nutrient disc increases, branching becomes more frequent. In particular, the first MC population rapidly becomes extinct and new branchings occur, with one population evolving towards MC behaviour (and eventually dying out) and the other population evolving towards UC.
Figure 6.
Figure 6.
Evolutionary branching in a heterogeneous resource landscape. Using a complex spatial distribution of patches (a) including both continuous (left wall), large and small patches, following a decreasing pattern, evolved populations display a whole range of adhesion values (b). The arrows indicate stable resource patches that display adhesion and persist in a stable manner despite their connection with larger patches dominated by repulsion. The evolution of diversity can be visualized as a multi-branched tree (c).

Similar articles

Cited by

References

    1. Grosberg RK, Strathmann RR. 2007. The evolution of multicellularity: a minor major transition? Annu. Rev. Ecol. Evol. Syst. 38, 621-654. (10.1146/annurev.ecolsys.36.102403.114735) - DOI
    1. Knoll AH. 2011. The multiple origins of complex multicellularity. Annu. Rev. Earth Planet. Sci. 39, 217-239. (10.1146/annurev.earth.031208.100209) - DOI
    1. Ruiz-Trillo I, Nedelcu AM (eds). 2015. Evolutionary transitions to multicellular life: principles and mechanisms, vol. 2. Berlin, Germany: Springer.
    1. Bonner JT. 2001. First signals: the evolution of multicellular development. Princeton, NJ: Princeton University Press.
    1. Ratcliff WC, Denison RF, Borrello M, Travisano M. 2012. Experimental evolution of multicellularity. Proc. Natl Acad. Sci. USA 109, 1595-1600. (10.1073/pnas.1115323109) - DOI - PMC - PubMed

Publication types

LinkOut - more resources