. 2020 Mar;158(4):1000-1015.
doi: 10.1053/j.gastro.2019.11.019. Epub 2019 Nov 16.

Drug Screen Identifies Leflunomide for Treatment of Inflammatory Bowel Disease Caused by TTC7A Deficiency

Affiliations

Drug Screen Identifies Leflunomide for Treatment of Inflammatory Bowel Disease Caused by TTC7A Deficiency

Sasha Jardine et al. Gastroenterology. 2020 Mar.

Abstract

Background & aims: Mutations in the tetratricopeptide repeat domain 7A gene (TTC7A) cause intestinal epithelial and immune defects. Patients can become immune deficient and develop apoptotic enterocolitis, multiple intestinal atresia, and recurrent intestinal stenosis. The intestinal disease in patients with TTC7A deficiency is severe and untreatable, and it recurs despite resection or allogeneic hematopoietic stem cell transplant. We screened drugs for those that prevent apoptosis of in cells with TTC7A deficiency and tested their effects in an animal model of the disease.

Methods: We developed a high-throughput screen to identify compounds approved by the US Food and Drug Administration that reduce activity of caspases 3 and 7 in TTC7A-knockout (TTC7A-KO) HAP1 (human haploid) cells and reduce the susceptibility to apoptosis. We validated the effects of identified agents in HeLa cells that stably express TTC7A with point mutations found in patients. Signaling pathways in cells were analyzed by immunoblots. We tested the effects of identified agents in zebrafish with disruption of ttc7a, which develop intestinal defects, and colonoids derived from biopsy samples of patients with and without mutations in TTC7A. We performed real-time imaging of intestinal peristalsis in zebrafish and histologic analyses of intestinal tissues from patients and zebrafish. Colonoids were analyzed by immunofluorescence and for ion transport.

Results: TTC7A-KO HAP1 cells have abnormal morphology and undergo apoptosis, due to increased levels of active caspases 3 and 7. We identified drugs that increased cell viability; leflunomide (used to treat patients with inflammatory conditions) reduced caspase 3 and 7 activity in cells by 96%. TTC7A-KO cells contained cleaved caspase 3 and had reduced levels of phosphorylated AKT and X-linked inhibitor of apoptosis (XIAP); incubation of these cells with leflunomide increased levels of phosphorylated AKT and XIAP and reduced levels of cleaved caspase 3. Administration of leflunomide to ttc7a-/- zebrafish increased gut motility, reduced intestinal tract narrowing, increased intestinal cell survival, increased sizes of intestinal luminal spaces, and restored villi and goblet cell morphology. Exposure of patient-derived colonoids to leflunomide increased cell survival, polarity, and transport function.

Conclusions: In a drug screen, we identified leflunomide as an agent that reduces apoptosis and activates AKT signaling in TTC7A-KO cells. In zebrafish with disruption of ttc7a, leflunomide restores gut motility, reduces intestinal tract narrowing, and increases intestinal cell survival. This drug might be repurposed for treatment of TTC7A deficiency.

Keywords: Animal Model; Cell Death; Genetic; Monogenic IBD.


Conflict of interest statement

Competing interests.

The authors declare no competing interests.

Figures

Figure 1.
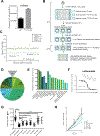
Figure 1.. TTC7A-KO cells have an increased susceptibility for apoptosis.
(A) Morphology of WT and TTC7A-KO HAP1 cells, DIC microscopy. Left panels, objective magnification 63× (scale bar 10μm). Right panels, objective magnification 4× (scale bar 190μm). Blebs and filopodia-like processes are indicated by arrow and arrowhead, respectively. Dashed-bars highlight differences in colony sizes after 48 h of culturing. (B) Real-time viability assay. Two-way ANOVA with post hoc test (Sidak), ****p<0.0001, (n=3, 3 replicates). (C) Annexin V-FITC/PI flow cytometry demonstrated that TTC7A-KO have significantly increased Annexin-V staining. Data is quantified in Supplementary Figure 2B. (D) Western blot analysis of untreated and IFNγ (10 ng/ml)//TNFα-treated (30 ng/ml) WT and TTC7A-KO cells, 48 h (n=3). Refer to Supplementary Figure 2C for cleaved Caspase 3 (CC3) quantitation.
Figure 2.
Figure 2.. High-throughput drug screening identifies approved-compounds that improve the apoptotic phenotype.
(A) Modeling the high-throughput apoptosis-phenotype assay. Caspase-Glo® 3/7 assay, z’=0.54, data are presented as the mean ±SD. Unpaired t test, ****p<0.0001, (n=3, 8 replicates). (B) Drug screen workflow. See Methods. (C) A sample of plate-results from the Prestwick Chemical Library screen showing mean Caspase 3/7 activity from drug-treated wells (green dots) and DMSO-treated control wells, WT (light blue dashes) and TTC7A-KO cells (dark blue dashes). Tiabendazole and tiaprofenic acid reduced Caspase 3/7 activity below the hit threshold (μWT-3σ), z’= 0.56. (D) Drug screen summary, 0.4% hit rate. Hit compounds represent the 10 drug classification families shown. (E) Comparison of hit compound inhibition of apoptosis in TTC7A-KO cells. Black borders represent FDA-approved drugs and bar colors correspond to Figure 2D. (F) Concentration-response curve for leflunomide inhibition of Caspase 3/7 activity in HAP1 TTC7A-KO cells, IC50=1.1 μM, (n=3). (G) Colony size formation in WT, TTC7A-KO, and drug-treated TTC7A-KO cells. Drug abbreviations: cyanocobalamin (CYANO), leflunomide (LEF), tiaprofenic acid (TIA), fenbufen (FEN), and fasudil (FAS). Plotted values represent individual cell colonies, error bars presented as mean ±SD. Statistical significance was relative to the KO/DMSO control. One-way ANOVA with post hoc test (Dunnett), ****p<0.0001, ***p<0.001, **p<0.01, (n=3, 6 replicates per condition). (H) Viability assay. Statistical significance relative to KO/DMSO (blue). WT (*p<0.05), KO/LEF (**p<0.01), KO/TIA (****p<0.0001), KO/FEN (***p<0.001), KO/FAS (****p<0.0001), two-way ANOVA with post hoc test (Dunnett), (n=3, 4 replicates per condition).
Figure 3.
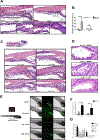
Figure 3.. Leflunomide rescues abnormal intestinal features in ttc7a −/− zebrafish.
(A) Histology from ttc7a −/− zebrafish (7 dpf) reveals pathological intestinal phenotypes. Control (ttc7a +/−) zebrafish display open luminal spaces with discernible villi projections (grey arrowhead), clefts (black arrowhead), monolayer epithelium (dotted-outlined area), and mature goblet cells with large vesicles (black arrows). ttc7a −/− zebrafish display narrowing of the intestinal bulb, stratified epithelium (yellow dotted-outlined area), signs of apoptosis (yellow arrows), and goblet cells with numerous small vesicles (yellow boxes). Objective magnification 10× and 40× for insets (scale bar 100 μm, inset scale bar 50 μm), (ttc7a +/− n=14, ttc7a −/− n=11). (B) Incidence of the narrow gut phenotype in DMSO and LEF treated fish. One-way ANOVA with post hoc test (Fisher’s LSD), ****p<0.0001, ttc7a +/− (DMSO n=49, LEF n=12), ttc7a −/− (DMSO n= 36, LEF n=26). (C) Intestinal histology from treated (see Methods) ttc7a−/− zebrafish. Leflunomide, cyanocobalamin and tiaprofenic acid suppressed the narrow-gut phenotype with minimal enterocyte crowding. Objective magnification 10×, (scale bar 100 μm). ttc7a+/− (DMSO n=49) ttc7a−/− (DMSO n= 36, CYANO n=10, LEF n=26, TIA n= 13, FEN n=13. (D) Assessment of apoptosis. DMSO or leflunomide treatment. ttc7a−/− zebrafish display fragmented, condensed or engulfed nuclei in the epithelium (arrows). Leflunomide treatment resulted in diminished signs of apoptosis, reduced intestinal epithelial cell crowding, and overall improved epithelium architecture in ttc7a−/− zebrafish. Refer to Supplementary Figure 7A for the quantitation of apoptotic cells/sample. Objective magnification 70× (scale bar 20 μm), (n=6 per group, across 3 experimental clutches). (E) Staining of the intestinal lumen in control (ttc7a+/−) and ttc7a-mutant (ttc7a−/−) zebrafish. Images are from peristalsis assays (Supplementary Video 2): intestinal lumen marked green fluorescent stain (DCFH-DA). ttc7a+/− fish have discernable villi (yellow arrow) and large continuous intestinal bulbs (double-headed white arrow). Representative ttc7a −/− intestinal phenotypes (i) atresia point (white arrow heads) (ii) narrow intestinal lumen and (iii) obstruction interrupting the intestinal bulb (white arrow). Objective magnification 4×, (scale bar 100 μm). (F) Incidence of ttc7a-mutant phenotypes. ttc7a−/− fish have significantly larger populations with motility and narrow lumen pathological phenotypes. Data are presented as the mean ±SD, one-way ANOVA with post hoc test (Fisher’s LSD), **p<0.0054, *p<0.0196, (n=50 total for each group, across 3 experimental clutches). (G) Phenotype summary from drug treated fish. ttc7a −/− fish with aberrant motility and narrow lumen phenotypes were significantly reduced with cyanocobalamin, leflunomide, tiaprofenic acid, and fenbufen treatment (3–7 dpf). Data are presented as the mean ±SD. Statistical significance was relative to ttc7a −/− DMSO control, and determined by two-way ANOVA with post hoc test (Dunnett), *p<0.05, **p<0.01, ***p<0.001, ns=not significant (DMSO n=18, CYANO n=21, LEF n=21, TIA n=17, FEN n=18, FAS n=13 for each group across 3 experimental clutches).
Figure 4.
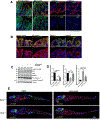
Figure 4.. p-AKT is reduced in TTC7A-deficiency.
(A) Histopathology analysis of p-AKT in human colon tissue. Co-staining of cytokeratin 20 (CK20), a marker for the intestinal epithelium, and p-AKT is present in the normal and IBD control, while p-AKT is diminished in TTC7A-deficiency patients. Patient 1 is the colonoid donor and Patient 2 is unpublished with confirmed biallelic mutations. RedDot 2 nuclear counterstain (blue). Sections were magnified at 20× objective. (B) Histopathology analysis of pan-AKT (total AKT) in human colon tissue. Biopsies are the same as described in Figure 5A. Pan-AKT is present in all samples albeit with reduced intensity in the TTC7A-deficiency patient samples. Sections were magnified at 20× objective. (C) Immunoblot for p-AKT, XIAP, and cleaved Caspase 3 in WT and TTC7A-KO cells. After 3 h leflunomide treatment in TTC7A-KO cells, p-AKT and XIAP protein levels are detectable, while cleaved Caspase 3 is diminished. DMSO (*) (n=3). (D) Densitometric analysis of p-AKT, XIAP, and cleaved Caspase 3 from WT and TTC7A-KO cells. One-way ANOVA with post hoc test (Tukey), *p<0.05, **p<0.01, ***p<0.001, ****p<0.0001, (n=3). (E) ttc7a+/− and ttc7a−/− whole mount zebrafish staining with p-AKT (red), Synaptic vesicle protein 2 (SV2) (green), and RedDot 2 nuclear counterstain (blue). SV2 staining, indicating neuromuscular junctions, is absent from the intestinal epithelial monolayer and aids in differentiating epithelial cells from other nearby cell types. In the DMSO treated panel, p-AKT staining (Ser473) in ttc7a+/− fish is evident along the gastrointestinal tract, while absent in ttc7a−/− fish. Leflunomide treatment (3–7 dpf) restores p-AKT staining in the intestinal epithelium of ttc7a−/− fish. Fish were magnified at 5× objective, (n=4).
Figure 5.
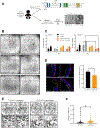
Figure 5.. Leflunomide treatment enhances survival and function of TTC7A-deficiency patient-colonoids.
(A) Personalized medicine approach to evaluate drug efficacy in human TTC7A-deficiency using patient-derived colonoids. Endoscopic biopsies were obtained from healthy control and TTC7A-deficiency (E71K and L304R compound heterozygous, TTC7Amut) patients and cultured into colonoids, which were then tested with leflunomide. (B) Leflunomide improves the survival of human colonoids derived from TTC7A-deficiency patients (TTC7Amut). Example images of control (TTC7A+/+) and TTC7A-deficient (TTC7Amut) colonoids with and without leflunomide (10 μM) treatment at 2 and 6 days and grown in the absence of ROCK inhibitor (Y27632). Red arrows indicate examples of dead colonoids. (C) Summary graph showing the percentage of dead TTC7Amut colonoids +/− leflunomide treatment. TTC7Amut and TTC7A+/+ colonoids were cultured +/− ROCK inhibitor (Y27632) or with leflunomide and viability was assessed at day 2 and 6. TTC7Amut colonoids grown without ROCK inhibitor have significantly increased death, which is reversed following leflunomide treatment. One-way ANOVA with post-hoc test (Tukey-Kramer), *p<0.05. **p<0.01. (D) Immunofluorescence staining of TTC7A+/+ and TTC7Amut colonoids with villin (green) marking the apical brush border and cytokeratin 20 (CK20, red) marking basal epithelial structure and DAPI (blue, nuclei). TTC7A+/+ colonoids show normal polarity with defined basal CK20 staining. TTC7Amut colonoids treated with ROCK inhibitor show grossly normal staining with mild cytological atypia. TTC7Amut colonoids without ROCK inhibitor show normal sidedness but abnormal polarity with cytological atypia and basal structural abnormalities which is improved in leflunomide treated colonoids. Quantification of abnormal polarity as assessed by the presence of multiple lumens in colonoids. Percentage of colonoids with multiple lumens in TTC7A-deficient colonoids with and without leflunomide (10 μM). Healthy control colonoids did not have multiple lumens (data not shown). Two tailed t-test, *p<0.05. (E-F) TTC7A-deficient colonoids (TTC7Amut) have a reduced swelling response to forskolin stimulation. Example images showing reduced swelling in TTC7Amut compared to TTC7Amut treated with leflunomide (10 μM). Inset panel show magnified images with red arrows indicating example colonoids pre and post swelling. Summary data showing significantly increased swelling in leflunomide (10 μM) treated TTC7Amut colonoids. Two tailed t-test, **p<0.01.
Figure 6.
Figure 6.. Model of leflunomide’s mechanism of action in TTC7A-deficiency.
(A) TTC7A-competent. 1, TTC7A binds and recruits PI4KIIIα to the plasma membrane. 2, PI4KIIIα phosphorylates PI lipids to create PI4P, precursor to PI (4,5)P2/ PI(3,4,5)P3. 3, PI3K phosphorylates PI (4,5)P2, required for AKT phosphorylation. p-AKT activates multiple downstream substrates that promote cell survival. For example, XIAP polyubiquitylates Pro Caspases 3,7, and 9 for proteasomal degradation, thereby reducing the susceptibility for Caspase-dependent cell death. (B) TTC7A-deficiency + leflunomide. 1, PI4KIIIα trafficking to (or kinase activity at) the plasma membrane is compromised in TTC7A-deficiency resulting in reduced PI4P. 2, Reduced p-AKT provides a rationale for increases in apoptosis. 3, Caspase-dependent apoptosis is frequently associated with TTC7A-deficiency. 4, Leflunomide treatment increases p-AKT and XIAP levels. 5, The apoptotic phenotype is ameliorated when TTC7A-deficient HAP1 cells are treated with leflunomide, suggesting a shift toward a survival phenotype. 6, It has yet to be established how leflunomide mediates p-AKT activation, however, PI3K-inhibition with LY294002 hinders leflunomide’s effect on AKT, XIAP, and Caspase 3 cleavage.

Similar articles

Cited by

References

    1. Avitzur Y, Guo C, Mastropaolo LA, et al. Mutations in tetratricopeptide repeat domain 7A result in a severe form of very early onset inflammatory bowel disease. Gastroenterology 2014;146:1028–39. - PMC - PubMed
    1. Bigorgne AE, Farin HF, Lemoine R, et al. TTC7A mutations disrupt intestinal epithelial apicobasal polarity. J Clin Invest 2014;124:328–37. - PMC - PubMed
    1. Jardine S, Dhingani N, Muise AM. TTC7A: Steward of Intestinal Health. Cell Mol Gastroenterol Hepatol 2019;7:555–570. - PMC - PubMed
    1. Lien R, Lin YF, Lai MW, et al. Novel Mutations of the Tetratricopeptide Repeat Domain 7A Gene and Phenotype/Genotype Comparison. Front Immunol 2017;8:1066. - PMC - PubMed
    1. Kammermeier J, Lucchini G, Pai SY, et al. Stem cell transplantation for tetratricopeptide repeat domain 7A deficiency: long-term follow-up. Blood 2016;128:1306–8. - PubMed

Publication types

MeSH terms

LinkOut - more resources