Bias caused by sampling error in meta-analysis with small sample sizes
- PMID: 30212588
- PMCID: PMC6136825
- DOI: 10.1371/journal.pone.0204056
Bias caused by sampling error in meta-analysis with small sample sizes
Abstract
Background: Meta-analyses frequently include studies with small sample sizes. Researchers usually fail to account for sampling error in the reported within-study variances; they model the observed study-specific effect sizes with the within-study variances and treat these sample variances as if they were the true variances. However, this sampling error may be influential when sample sizes are small. This article illustrates that the sampling error may lead to substantial bias in meta-analysis results.
Methods: We conducted extensive simulation studies to assess the bias caused by sampling error. Meta-analyses with continuous and binary outcomes were simulated with various ranges of sample size and extents of heterogeneity. We evaluated the bias and the confidence interval coverage for five commonly-used effect sizes (i.e., the mean difference, standardized mean difference, odds ratio, risk ratio, and risk difference).
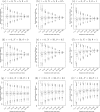
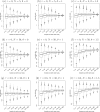
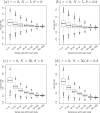
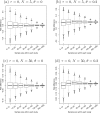
Results: Sampling error did not cause noticeable bias when the effect size was the mean difference, but the standardized mean difference, odds ratio, risk ratio, and risk difference suffered from this bias to different extents. The bias in the estimated overall odds ratio and risk ratio was noticeable even when each individual study had more than 50 samples under some settings. Also, Hedges' g, which is a bias-corrected estimate of the standardized mean difference within studies, might lead to larger bias than Cohen's d in meta-analysis results.
Conclusions: Cautions are needed to perform meta-analyses with small sample sizes. The reported within-study variances may not be simply treated as the true variances, and their sampling error should be fully considered in such meta-analyses.
Conflict of interest statement
The authors have declared that no competing interests exist.
Figures


Similar articles
-
Folic acid supplementation and malaria susceptibility and severity among people taking antifolate antimalarial drugs in endemic areas.Cochrane Database Syst Rev. 2022 Feb 1;2(2022):CD014217. doi: 10.1002/14651858.CD014217. Cochrane Database Syst Rev. 2022. PMID: 36321557 Free PMC article.
-
Evaluation of various estimators for standardized mean difference in meta-analysis.Stat Med. 2021 Jan 30;40(2):403-426. doi: 10.1002/sim.8781. Epub 2020 Nov 12. Stat Med. 2021. PMID: 33180373 Free PMC article.
-
Correction for bias in meta-analysis of little-replicated studies.Methods Ecol Evol. 2018 Mar;9(3):634-644. doi: 10.1111/2041-210X.12927. Epub 2017 Nov 21. Methods Ecol Evol. 2018. PMID: 29938012 Free PMC article.
-
Meta-Analytic Statistical Inferences for Continuous Measure Outcomes as a Function of Effect Size Metric and Other Assumptions [Internet].Rockville (MD): Agency for Healthcare Research and Quality (US); 2013 Apr. Report No.: 13-EHC075-EF. Rockville (MD): Agency for Healthcare Research and Quality (US); 2013 Apr. Report No.: 13-EHC075-EF. PMID: 23741762 Free Books & Documents. Review.
-
Publication bias in ecology and evolution: an empirical assessment using the 'trim and fill' method.Biol Rev Camb Philos Soc. 2002 May;77(2):211-22. doi: 10.1017/s1464793101005875. Biol Rev Camb Philos Soc. 2002. PMID: 12056747 Review.
Cited by
-
Bloodletting for Acute Stroke Recovery: A Systematic Review and Meta-Analysis.Healthcare (Basel). 2024 Oct 17;12(20):2060. doi: 10.3390/healthcare12202060. Healthcare (Basel). 2024. PMID: 39451475 Free PMC article. Review.
-
Examining the reliability of the scores of self-report instruments assessing problematic exercise: A systematic review and meta-analysis.J Behav Addict. 2022 Apr 28;11(2):326-47. doi: 10.1556/2006.2022.00014. Online ahead of print. J Behav Addict. 2022. PMID: 35482912 Free PMC article. Review.
-
Correlation between neutrophil-to-lymphocyte ratio and postoperative mortality in elderly patients with hip fracture: a meta-analysis.J Orthop Surg Res. 2021 Nov 18;16(1):681. doi: 10.1186/s13018-021-02831-6. J Orthop Surg Res. 2021. PMID: 34794459 Free PMC article.
-
Recruitment rates and strategies in exercise trials in cancer survivorship: a systematic review.J Cancer Surviv. 2024 Aug;18(4):1233-1242. doi: 10.1007/s11764-023-01363-8. Epub 2023 Apr 6. J Cancer Surviv. 2024. PMID: 37022641 Free PMC article.
-
Meta-analysis of several epidemic characteristics of COVID-19.J Data Sci. 2020 Jul;18(3):536-549. doi: 10.6339/JDS.202007_18(3).0019. J Data Sci. 2020. PMID: 33088292 Free PMC article.
References
Publication types
MeSH terms
Grants and funding
LinkOut - more resources
Full Text Sources
Other Literature Sources

