Characterisation of the protein corona using tunable resistive pulse sensing: determining the change and distribution of a particle's surface charge
- PMID: 27287012
- PMCID: PMC4958399
- DOI: 10.1007/s00216-016-9678-6
Characterisation of the protein corona using tunable resistive pulse sensing: determining the change and distribution of a particle's surface charge
Erratum in
-
Erratum to: Characterisation of the protein corona using tunable resistive pulse sensing: determining the change and distribution of a particle's surface charge.Anal Bioanal Chem. 2017 Jan;409(1):349. doi: 10.1007/s00216-016-0009-8. Epub 2016 Oct 15. Anal Bioanal Chem. 2017. PMID: 27744481 Free PMC article. No abstract available.
Abstract
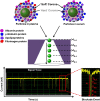
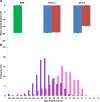
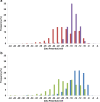
The zeta potential of the protein corona around carboxyl particles has been measured using tunable resistive pulse sensing (TRPS). A simple and rapid assay for characterising zeta potentials within buffer, serum and plasma is presented monitoring the change, magnitude and distribution of proteins on the particle surface. First, we measure the change in zeta potential of carboxyl-functionalised nanoparticles in solutions that contain biologically relevant concentrations of individual proteins, typically constituted in plasma and serum, and observe a significant difference in distributions and zeta values between room temperature and 37 °C assays. The effect is protein dependent, and the largest difference between the two temperatures is recorded for the γ-globulin protein where the mean zeta potential changes from -16.7 to -9.0 mV for 25 and 37 °C, respectively. This method is further applied to monitor particles placed into serum and/or plasma. A temperature-dependent change is again observed with serum showing a 4.9 mV difference in zeta potential between samples incubated at 25 and 37 °C; this shift was larger than that observed for samples in plasma (0.4 mV). Finally, we monitor the kinetics of the corona reorientation for particles initially placed into serum and then adding 5 % (V/V) plasma. The technology presented offers an interesting insight into protein corona structure and kinetics of formation measured in biologically relevant solutions, i.e. high protein, high salt levels, and its particle-by-particle analysis gives a measure of the distribution of particle zeta potential that may offer a better understanding of the behaviour of nanoparticles in solution. Graphical Abstract The relative velocity of a nanoparticle as it traverses a nanopore can be used to determine its zeta potential. Monitoring the changes in translocation speeds can therefore be used to follow changes to the surface chemistry/composition of 210 nm particles that were placed into protein rich solutions, serum and plasma. The particle-by-particle measurements allow the zeta potential and distribution of the particles to be characterised, illustrating the effects of protein concentration and temperature on the protein corona. When placed into a solution containing a mixture of proteins, the affinity of the protein to the particle's surface determines the corona structure, and is not dependent on the protein concentration.
Keywords: Biosensor; Protein corona; TRPS; Tunable pores; Zeta potential.
Conflict of interest statement
The authors declare no competing interests. Human and animal rights and informed consent This work has been performed with the consent of healthy volunteers. The studies were approved by the ethics committee and performed in accordance of the ethical standards or Loughborough University.
Figures


Similar articles
-
Size and ζ-Potential Measurement of Silica Nanoparticles in Serum Using Tunable Resistive Pulse Sensing.Langmuir. 2016 Mar 8;32(9):2216-24. doi: 10.1021/acs.langmuir.5b04160. Epub 2016 Feb 22. Langmuir. 2016. PMID: 26869024
-
Intentional formation of a protein corona on nanoparticles: Serum concentration affects protein corona mass, surface charge, and nanoparticle-cell interaction.Int J Biochem Cell Biol. 2016 Jun;75:196-202. doi: 10.1016/j.biocel.2015.11.005. Epub 2015 Nov 10. Int J Biochem Cell Biol. 2016. PMID: 26556312
-
Tailor-Made Protein Corona Formation on Polystyrene Microparticles and its Effect on Epithelial Cell Uptake.ACS Appl Mater Interfaces. 2022 Oct 19;14(41):47277-47287. doi: 10.1021/acsami.2c13987. Epub 2022 Oct 4. ACS Appl Mater Interfaces. 2022. PMID: 36194482
-
How Corona Formation Impacts Nanomaterials as Drug Carriers.Mol Pharm. 2020 Mar 2;17(3):725-737. doi: 10.1021/acs.molpharmaceut.9b01111. Epub 2020 Jan 24. Mol Pharm. 2020. PMID: 31939673 Review.
-
Influence of surface chemistry and morphology of nanoparticles on protein corona formation.Wiley Interdiscip Rev Nanomed Nanobiotechnol. 2022 Jul;14(4):e1788. doi: 10.1002/wnan.1788. Epub 2022 Mar 7. Wiley Interdiscip Rev Nanomed Nanobiotechnol. 2022. PMID: 35257495 Free PMC article. Review.
Cited by
-
Single Particle Chemical Characterisation of Nanoformulations for Cargo Delivery.AAPS J. 2023 Oct 2;25(6):94. doi: 10.1208/s12248-023-00855-w. AAPS J. 2023. PMID: 37783923 Review.
-
Two-Photon Nanolithography of Tailored Hollow three-dimensional Microdevices for Biosystems.ACS Omega. 2019 Jan 16;4(1):1401-1409. doi: 10.1021/acsomega.8b03164. eCollection 2019 Jan 31. ACS Omega. 2019. PMID: 31459407 Free PMC article.
-
The nanotopography of SiO2 particles impacts the selectivity and 3D fold of bound allergens.Nanoscale. 2021 Dec 16;13(48):20508-20520. doi: 10.1039/d1nr05958k. Nanoscale. 2021. PMID: 34854455 Free PMC article.
-
Protein nanoparticles in drug delivery: animal protein, plant proteins and protein cages, albumin nanoparticles.J Nanobiotechnology. 2021 May 29;19(1):159. doi: 10.1186/s12951-021-00896-3. J Nanobiotechnology. 2021. PMID: 34051806 Free PMC article. Review.
-
Gut Microbiota-Derived Small Extracellular Vesicles Endorse Memory-like Inflammatory Responses in Murine Neutrophils.Biomedicines. 2022 Feb 14;10(2):442. doi: 10.3390/biomedicines10020442. Biomedicines. 2022. PMID: 35203650 Free PMC article.
References
-
- Rolland JP, Maynor BW, Euliss LE, Exner AE, Denison GM, Desimone JM. Direct fabrication and harvesting of monodisperse, shape-specific nanobiomaterials. J Am Chem Soc. 2005;127(28):10096–100. - PubMed
-
- Temer S, Zhong L, Travis C, Mostafa A. Shape-controlled synthesis of colloidal platinum nanoparticles. 1996; - PubMed
-
- Cuenya BR. Synthesis and catalytic properties of metal nanoparticles : size, shape, support, composition, and oxidation state effects. Thin Solid Films. 2010;518(12):3127–50.
-
- Perrault SD, Chan WCW. Synthesis and surface modification of highly monodispersed, spherical gold nanoparticles of 50–200 nm. 2009;17042–3. - PubMed
-
- Perrault SD, Walkey C, Jennings T, Fischer HC, Chan WCW. Mediating tumor targeting efficiency of nanoparticles through design. Nano Lett. 2009;9(5):1909–15. - PubMed
MeSH terms
Substances
LinkOut - more resources
Full Text Sources
Other Literature Sources

