Case Reports

Dominant β-catenin mutations cause intellectual disability with recognizable syndromic features

Valter Tucci et al. J Clin Invest. 2014 Apr.

Abstract

The recent identification of multiple dominant mutations in the gene encoding β-catenin in both humans and mice has enabled exploration of the molecular and cellular basis of β-catenin function in cognitive impairment. In humans, β-catenin mutations that cause a spectrum of neurodevelopmental disorders have been identified. We identified de novo β-catenin mutations in patients with intellectual disability, carefully characterized their phenotypes, and were able to define a recognizable intellectual disability syndrome. In parallel, characterization of a chemically mutagenized mouse line that displays features similar to those of human patients with β-catenin mutations enabled us to investigate the consequences of β-catenin dysfunction through development and into adulthood. The mouse mutant, designated batface (Bfc), carries a Thr653Lys substitution in the C-terminal armadillo repeat of β-catenin and displayed a reduced affinity for membrane-associated cadherins. In association with this decreased cadherin interaction, we found that the mutation results in decreased intrahemispheric connections, with deficits in dendritic branching, long-term potentiation, and cognitive function. Our study provides in vivo evidence that dominant mutations in β-catenin underlie losses in its adhesion-related functions, which leads to severe consequences, including intellectual disability, childhood hypotonia, progressive spasticity of lower limbs, and abnormal craniofacial features in adults.


Figures

Figure 1
Figure 1. Craniofacial anomalies associated with β-catenin mutations in humans and mice.
(A) Patients 1 (at the age of 4 years), 2 (at the age of 29 years), 3 (at the age of 24 years and 51 years), and 4 (at the age of 14 years) with de novo mutations in CTNNB1 (p.Gln309*, p.Ser425Thrfs*11, p.Arg515*, and p.Gly236Argfs*35, respectively). Note the overlap in craniofacial features including microcephaly, a full tip of the nose, and thin upper lip. Written informed consent was obtained to use the medical data and photographs from legal representatives of the 4 patients. (B) Broad-face phenotype characteristic of all Bfc/+ adults compared with a WT littermate control. (C) Broad-face phenotype in Bfc/+ is associated with a short snout and broad skull as determined by x-ray scanner. (D) Sequence analysis of Ctnnb1 in Bfc/+ and WT DNA revealing a C-to-A transition at nucleotide position 2245 in the Bfc mutant. This missense mutation results in a Thr653Lys amino acid substitution. (E) Protein sequence alignment of CTNNB1 in human, mouse, and other vertebrate species. The Thr653Lys substitution lies within the highly conserved 12th armadillo repeat of the protein. (F) Representative structure of CTNNB1 showing N- and C-terminal domains and the Arm12 repeats. The approximate positions of 5 human (Thr551Met from ref. 12) mutations and the Thr653Lys mouse mutation are indicated.
Figure 2
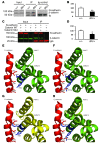
Figure 2. The Thr653Lys mutation disrupts the murine β-catenin–cadherin complex.
(A) Western blot of adult hippocampal whole-cell lysates immunoprecipitated with anti–N-cadherin. Typical N-cadherin and β-catenin immunoreactive bands are shown. An Ig control lysate IP using normal rabbit IgG is included. Black lines indicate noncontiguous regions. (B) β-catenin immunoreactivity was normalized to immunoprecipitated N-cadherin, revealing a 46% reduced interaction in mutant hippocampal lysates (n = 7, **P < 0.01). (C) Western blot of lysates from HEK293 cells transfected with N-cadherin–EGFP and β-catenin–V5/His and immunoprecipitated with anti-EGFP. Control IPs were carried out from cells transfected with only the WT β-catenin–V5/His plasmid. White lines indicate noncontiguous regions. (D) Recombinant β-catenin immunoreactivity was normalized to immunoprecipitated recombinant N-cadherin, confirming reduced interaction (40% reduction, n = 3, *P = 0.03). (E) Close-up view of the interacting residues in the WT complex. β-catenin is shown in green. T653 and Y654 (blue sticks) in β-catenin are both located on the surface of the ARM12 helix 3. E-cadherin (red) helix is shown with contacting residues D665 and L661. D665 of E-cadherin forms the hydrogen bond with Y654. (F) Description is the same as in E; however, the phosphorylated tyrosine (Y654-p) residue is shown. (G) Close-up view of interacting residues in the mutant form (T653K). K653 (blue sticks) is shown in the IntFOLD2 (35, 36) model of the β-catenin armadillo domain (yellow). The mutant residue extends to contact the E-cadherin backbone (red). (H) 3D-modeled β-catenin with the K653 mutation superimposed on the crystal structure of β-catenin, showing K653 with Y654-p vis-a-vis the E-cadherin–interacting residues: D665, L661, and I657.
Figure 3
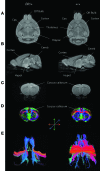
Figure 3. MRI scans of Bfc/+ mice reveal major brain abnormalities.
MRI scans of Bfc/+ mice highlighted an altered cranial shape with a larger left-right axis and a shorter longitudinal extension compared with controls. The effect was apparent in horizontal (A) and sagital (B) views of the brain. The olfactory bulbs and cerebellum appeared to be significantly smaller in Bfc/+ individuals compared with control littermates. In 3 out of 10 Bfc/+ subjects, the corpus callosum appeared to be severely underdeveloped, lacking any interhemispheric extension. This was apparent in anatomical T2-weighted images (C) as well as in diffusion-weighted scans (D and E). Diffusion tensor images (DTI) modulated by FA (D) and DTI tractography corroborated the lack of interhemispheric connection of the corpus callosum in all of the 3 subjects, showing abnormal callosal anatomy in anatomical MRI images (C, D, and E show data from representative Bfc/+ and control subjects). Normal interhemispheric tracts were observed in all the control subject images. Cereb, cerebellum; Cpu, caudate putamen; Olf Bulb, olfactory bulbs; Hippoc, hippocampus; Hypot, hypothalamus.
Figure 4
Figure 4. Behavioral phenotypes of Bfc/+ adult mice.
(A) ASR in Bfc/+ (n = 10) mice is unaffected compared with that of controls (n = 10). (B) Reduction in PPI is extremely robust, with significant reductions seen in Bfc/+ mice. (C) Rotarod performance over 3 daily sessions is lower in Bfc/+ (n = 10) mice compared with controls (n = 10), although their performance has improved by the third day. (D) Ultrasonic vocalizations are disrupted in Bfc/+ (n = 10) mice compared with littermate controls (n = 10), with reductions in the total number of calls upon separation and in the average call duration. (E) Call complexity is also lower in mutants. with a significantly lower number of elements per call. (F) Representative ultrasonic vocalizations for WT mice and Bfc/+ littermates. *P < 0.05, **P < 0.01, Student’s t test.
Figure 5
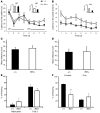
Figure 5. A number of parameters of learning and memory are deficient in Bfc/+ mice.
WM test showing mean latencies to reach the escape platform are plotted for daily sessions over 8 training days (A) and for probes (B) in Bfc/+ and littermate controls (n = 10). Visible platform (VP) and hidden platform (HP) conditions are marked along the training. Mean distances for regular training (C) and probe (D) trials are plotted. In the fear conditioning test, freezing time during habituation and training (E) and exposure to the context and cue conditions (F) are presented for Bfc/+ mice (n = 8) and littermate controls (n = 8). *P < 0.05, ***P < 0.001; Student’s t test.
Figure 6
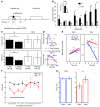
Figure 6. Bfc/+ mice show deficits in temporal cognition.
(A) The peak procedure task. Probes differ from normal trials, as the light stimulus is not followed by any reward. (B) Mean nose pokes for the rewarded time windows (RTWs) within each session are presented for normal trials over 8 consecutive days and all probe trials. Bfc/+ mice (n = 12) do not increase nose poking within the RTW as +/+ mice do (n = 12). (C) Timing responses are collected in a home-cage apparatus using separate mouse cohorts (n = 6). Peak time and width (spread) decrease significantly between the first and last day in +/+, but not in Bfc/+ mice. *P < 0.05; **P < 0.01. (D) Peak distribution for the first (red) and last (blue) days for representative +/+ and Bfc/+ mice. (E) Start and stop times test anticipatory and perseverative behaviors. WT mice show a progressive optimization (increasing the start time and decreasing the stop time) in their responses, corresponding with reward delivery time. Interestingly, Bfc/+ mice do not modify stop time responses, indicating a perseverative response within trials. (F) Timing is assessed for 2 intervals (short vs. long), and only correct responses are rewarded. Error rates are calculated and plotted in 3-hour bins; the blue bar represents the dark phase of the 12-hour light/12-hour dark cycle. A comparison of behaviors during the dark (active) and light (inactive) phases is shown for Bfc/+ and +/+ mice (G). No phase differences in behavior are evident in Bfc/+ mice, while the error rate significantly increases in WT animals in the light phase.
Figure 7
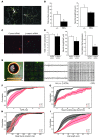
Figure 7. Morphological and functional deficits in Bfc/+ primary hippocampal neuronal cultures.
(A) Representative images of primary cultures of +/+ and Bfc/+ hippocampal neurons after 8 days in culture. Scale bars are as indicated. Primary processes are shown in green, secondary processes in yellow. (B) Number of processes and neurite length are presented. Processes are significantly less in Bfc/+ neurons. *P = 0.02, 2-tailed t test. (C) Representative images of neuronal cultures transfected at 1 DIV with β-catenin or control siRNA and fixed at 7 DIV. (D) siRNA against β-catenin efficiently decreased mRNA expression, as assessed by RT-qPCR (P < 0.01), while neurite extension was significantly reduced (*P < 0.05) in β-catenin–transfected neurons. (E) In vitro neuronal network set-up showing (left to right) the high-density MEA chip, fluorescence image of the low density culture (β3-tubulin green, NeuN red) showing the sparse network distribution on a portion of the electrode array (black square), raw data traces of spiking activity acquired from 3 different channels, raster plot of approximately 400 active channels (i.e., firing rate > 0.1 spike/s) showing synchronous firing and sustained bursting activity. (FI) cumulative distributions of network parameters (+/+ black, n = 4; Bfc/+ red, n = 6). Bold lines and shaded regions correspond to mean ± SEM. The Bfc/+ cultures were more excitable, as evidenced by the higher MFR (F) and MBR (G). Less evident is the variation for the MBD (H). The functional connectivity analysis based on cross-correlation shows that functional link length was also higher in Bfc/+ (I).
Figure 8
Figure 8. Morphological and functional synaptic deficits in Bfc/+ adult hippocampus.
(A) Representative electron microscope images from WT and heterozygous CA1 synapses; images show a section of a presynaptic axonal bouton (ax) containing the cluster of SVs and mitochondria (M) and the dendrite of a postsynaptic neuron (D); the postsynaptic density (PSD) is also visible (arrowhead). Scale bar: 200 nm. (B) Quantification of membrane-docked SV density (vesicles/μm) and PSD length (μm) was performed for 142 CA1 and 128 cortical +/+ (n = 3) and 152 CA1 and 115 cortical Bfc/+ (n = 3) excitatory presynaptic terminals using ImageJ. (C) Experimental configuration used to perform electrophysiological recordings in adult hippocampal slices. (D) Slope of the fEPSP as a function of injected current recorded in hippocampal slices from WT (black squares, n = 7 mice, 10 slices) and Bfc/+ (white circles, n = 7 mice, 10 slices) animals. Representative traces are shown (inset). (E) Paired-pulse ratio as a function of the interstimulus interval for WT (n = 7 mice, 9 slices) and Bfc/+ (n = 7 mice, 9 slices) mice. Traces (inset) are normalized to the first stimulus fEPSP amplitude. (F and G) Slope of the fEPSP before and after tetanic (F) or θ-burst (G) stimulation in WT (black squares) and Bfc/+ (white circles) slices. Values are normalized to the fEPSP slope value under control conditions. (F) WT, n = 5 mice, 5 slices; Bfc/+, n = 5 mice, 6 slices. (G) WT, n = 4 mice, 5 slices; Bfc/+, n = 5 mice, 6 slices. Traces (inset) are normalized to the amplitude of the fEPSP under control conditions. **P < 0.01, ***P < 0.001.

Similar articles

Cited by

References

    1. Jamieson C, Sharma M, Henderson BR. Wnt signaling from membrane to nucleus: β-catenin caught in a loop. Int J Biochem Cell Biol. 2012;44(6):847–850. doi: 10.1016/j.biocel.2012.03.001. - DOI - PubMed
    1. Xing Y, et al. Crystal structure of a full-length β-catenin. Structure. 2008;16(3):478–487. doi: 10.1016/j.str.2007.12.021. - DOI - PMC - PubMed
    1. Grigoryan T, Wend P, Klaus A, Birchmeier W. Deciphering the function of canonical Wnt signals in development and disease: conditional loss- and gain-of-function mutations of β-catenin in mice. Genes Dev. 2008;22(17):2308–2341. doi: 10.1101/gad.1686208. - DOI - PMC - PubMed
    1. Salinas PC, Price SR. Cadherins and catenins in synapse development. Curr Opin Neurobiol. 2005;15(1):73–80. doi: 10.1016/j.conb.2005.01.001. - DOI - PubMed
    1. Huber AH, Weis WI. The structure of the β-catenin/E-cadherin complex and the molecular basis of diverse ligand recognition by β-catenin. Cell. 2001;105(3):391–402. doi: 10.1016/S0092-8674(01)00330-0. - DOI - PubMed

Publication types

MeSH terms