. 2013 Oct;136(Pt 10):3119-39.
doi: 10.1093/brain/awt227. Epub 2013 Sep 11.

Defective autophagy in spastizin mutated patients with hereditary spastic paraparesis type 15

Affiliations

Defective autophagy in spastizin mutated patients with hereditary spastic paraparesis type 15

Chiara Vantaggiato et al. Brain. 2013 Oct.

Abstract

Hereditary spastic paraparesis type 15 is a recessive complicated form of the disease clinically characterized by slowly progressive spastic paraparesis and mental deterioration with onset between the first and second decade of life. Thinning of corpus callosum is the neuroradiological distinctive sign frequently associated with white matter abnormalities. The causative gene, ZFYVE26, encodes a large protein of 2539 amino acid residues, termed spastizin, containing three recognizable domains: a zinc finger, a leucine zipper and a FYVE domain. Spastizin protein has a diffuse cytoplasmic distribution and co-localizes partially with early endosomes, the endoplasmic reticulum, microtubules and vesicles involved in protein trafficking. In addition, spastizin localizes to the mid-body during the final step of mitosis and contributes to successful cytokinesis. Spastizin interacts with Beclin 1, a protein required for cytokinesis and autophagy, which is the major lysosome-mediated degradation process in the cell. In view of the Beclin 1-spastizin interaction, we investigated the possible role of spastizin in autophagy. We carried out this analysis by using lymphoblast and fibroblast cells derived from four different spastizin mutated patients (p.I508N, p.L243P, p.R1209fsX, p.S1312X) and from control subjects. Of note, the truncating p.R1209fsX and p.S1312X mutations lead to loss of spastizin protein. The results obtained indicate that spastizin interacts with the autophagy related Beclin 1-UVRAG-Rubicon multiprotein complex and is required for autophagosome maturation. In cells lacking spastizin or with mutated forms of the protein, spastizin interaction with Beclin 1 is lost although the formation of the Beclin 1-UVRAG-Rubicon complex can still be observed. However, in these cells we demonstrate an impairment of autophagosome maturation and an accumulation of immature autophagosomes. Autophagy defects with autophagosome accumulation can be observed also in neuronal cells upon spastizin silencing. These results indicate that autophagy is a central process in the pathogenesis of complicated forms of hereditary spastic paraparesis with thin corpus callosum.

Keywords: Beclin 1; SPG15; autophagosome maturation; autophagy; spastizin.


Figures
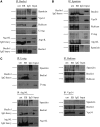
Figure 1
Figure 1
Spastizin interacts with Beclin 1, Vps34, Rubicon and UVRAG in HeLa cells. Total protein extracts were prepared from HeLa cells untreated (unt) or starved with Earle’s Balanced Salt Solution (EB) for 2 h and then subjected to immunoprecipitation (IP) with anti-Beclin 1 (A), anti-spastizin (B) and anti-UVRAG,-Rubicon, -Atg14L or -Vps34 antibodies (C). Proteins were loaded on 6% polyacrylamide gels. Total protein extracts used for the immunoprecipitation were loaded as positive control (Input). Total protein extracts were immunoprecipitated also with an antibody against rabbit IgG isotype as negative control (IgG). Specific bands are indicated by the arrows. The 50 kDa rabbit IgG heavy chain is indicated (IgG heavy) where present. Shown is a representative of three reproducible blots.
Figure 2
Figure 2
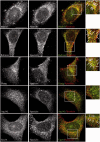
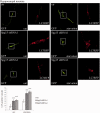
Spastizin partially co-localizes with Beclin 1, Rubicon, UVRAG and Vps34 in HeLa cells. Untreated HeLa cells were fixed and immunostained with anti-spastizin (red) and anti-Beclin 1, -Rubicon, -UVRAG, -Atg14 and -Vps34 (green) antibodies. Yellow in the merge images indicates partial co-localization of spastizin with Beclin 1, Rubicon, UVRAG and Vps34. Co-localization is indicated by arrows in the magnified boxed area on the right. Scale bar = 10 µm.
Figure 3
Figure 3
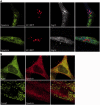
Spastizin does not localize on autophagy-related structures. (A) HeLa cells were transfected with MAP1LC3BRFP for the staining of autophagosomes (red), 24 h later cells were starved with Earle’s Balanced Salt Solution for 30 min, fixed and immunostained with anti-spastizin (green) and anti-Atg12 or Atg16 (blue) antibodies. Spastizin does not co-localize with the autophagosomal marker LC3 or with the isolation membrane markers Atg12 and Atg16. Scale bar = 10 µm. (B) Untreated HeLa cells were fixed and immunostained with anti-spastizin (red) and anti-Rab5 or -LAMP2 (green) antibodies. Yellow in the merge images indicates co-localization of spastizin with early endosomes. Scale bar = 10 µm.
Figure 4
Figure 4
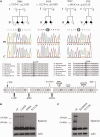
Patient's families and ZFYVE26 mutations. (A) Pedigrees of the families carrying the ZFYVE26 mutations here identified. Arrows indicate the proband in each family. Asterisks indicate the subjects for whom DNA was available. Elechtropherograms of mutant and control sequences are shown below, with boxes indicating the mutant nucleotide for each mutation. A partial multiple alignment of protein sequences of human spastizin and orthologues from other species with positions of the mutant residues (L243P and I508N) boxed is shown below. A schematic representation of spastizin protein domains is shown with a summary of the spastizin mutations identified in this work (L243P, I508N and S1312X) and analysed (L243P, I508N, S1312X and R1209fsX in Hanein et al., 2008). (B) Spastizin protein levels in spastizin mutated cells. Total extracts prepared from L243P, I508N, and S1312X mutated and control (ctr) lymphoblast cells were run on 6% SDS-polyacrylamide gel and stained with an anti-spastizin antibody directed against the N-terminus of the protein and with anti-actin antibody. Whereas L243P and I508N mutated cells express spastizin at the expected 280 kDa size, no signal is observed in S1312X mutated cells at the size of 154 kDa corresponding to the truncated protein. (C) Spastizin protein levels in R1209fsX mutated fibroblast. Total extracts prepared from R1209fsX, S1312X and control fibroblasts were run on 6% SDS-polyacrylamide gel and stained with an anti-spastizin antibody directed against the N-terminus of the protein and with anti-actin antibody. No signal is observed in R1209fsX mutated cells at the size of 135 kDa corresponding to the truncated protein, analogously to what is observed in S1312X mutated fibroblasts.
Figure 5
Figure 5
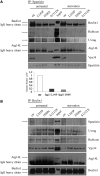
SPG15-related mutations alter spastizin interactions with Beclin 1-complexes. Total protein extracts were prepared from lymphoblastoid cells untreated or starved with Earle’s Balanced Salt Solution for 2 h (starvation) and subjected to immunoprecipitation (IP) with anti-spastizin (A) or anti-Beclin 1 (B) antibodies. Proteins were loaded on 6% SDS-polyacrylamide gels. Total protein extracts used for the IP were tested for the presence of relevant proteins with similar results in all cell lines and control cell extracts were loaded as positive control (Input). Specific bands are indicated by the arrows. Where present, the 50 kDa rabbit IgG heavy chain is also indicated. Shown is a representative of three reproducible blots. Beclin 1 levels in untreated control and L243P, I508N and S1312X mutated cells were quantified from A, normalized on IgG and shown in the graph.
Figure 6
Figure 6
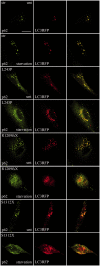
Spastizin mutations induce accumulation of autophagosomes in fibroblast cells. Control (ctr) and L243P, R1209fsX and S1312X spastizin mutated fibroblast cells were transfected with MAP1LC3B-RFP for the staining of autophagosomal vesicles (red) and 24 h later were starved for 2 h to induce autophagy (starvation), fixed and immunostained with anti-p62 (green) antibody. Yellow in the merge images indicates co-localization of p62 and LC3. LC3-positive vesicles quantification is shown in Fig. 7B. Scale bar = 10 µm. unt = untreated.
Figure 7
Figure 7
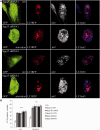
Spastizin depletion induces accumulation of autophagosomes in cells in which spastizin had been silenced. Control fibroblast cells were transfected with two different Spg15 short hairpin RNA vectors (shRNA1 or shRNA2), showing similar silencing efficiency, both with a GFP tag (green) and with MAP1LC3B-RFP for the staining of autophagosomes (red). Forty-eight hours later cells were starved for 2 h (starvation), fixed and immunostained with anti-p62 (blue) antibody. Violet in the merge indicates co-localization of p62 and LC3. Scale bar = 10 µm. (B) Quantification of LC3-positive vesicles from the silenced fibroblasts above and from controls and mutated cells of Fig. 6 is shown in the graph. The graph shows the mean ± SEM of three independent experiments for a total of at least 30 cells for each sample (***P < 0.001).
Figure 8
Figure 8
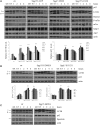
Spastizin mutations induce an increase in LC3-II and p62 levels. (A) Lymphoblastoid cells from patients carrying L243P, I508N and S1312X spastizin mutations, three healthy control individuals and one healthy carrier from the I508N mutated family were starved with Earle’s Balanced Salt Solution for different times, from 30 min to 6 h to induce autophagy. Untreated and treated cells were lysed and total protein extracts were run on 6 or 10% SDS-polyacrylamide gels and probed with anti-p62, LC3B, -Beclin 1, -mTor, -phospho-mTor (P-mTor), -LAMP1, -Atg7 and -actin antibodies. In the figure is shown only one control (ctr), whereas results from the remaining three controls are reported in Supplementary Fig. 7A. Arrows indicate the two isoforms LC3-I and LC3-II. LC3-II and p62 levels were quantified and normalized on actin levels. The graphs show the mean ± SEM of three independent experiments (***P < 0.001). The mean of all the four controls is reported in the graphs. (B) Fibroblast cells from patients carrying R1209fsX and S1312X spastizin mutations and from a control were starved as in A to induce autophagy. Total protein extracts were run on 12% SDS-polyacrylamide gels and probed with anti-LC3B, -p62 and -actin antibodies. Shown is a representative of three reproducible blots. LC3-II and p62 levels were quantified and normalized on actin levels. The graphs show the mean ± SEM of three independent experiments (***P < 0.001). (C) Silencing of ZFYVE26 increases LC3-II and p62 levels. HeLa cells were transfected with Spg15 short hairpin RNA or with a control vector (ctr) and 72 h later were starved to induce autophagy. Total extracts were probed with anti-LC3B, -p62, -actin and -spastizin antibodies, the latter to show the residual spastizin levels in ZFYVE26 (Spg15) short hairpin RNA-transfected cells. Shown is a representative of three reproducible blots.
Figure 9
Figure 9
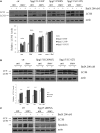
Analysis of the effect of autophagy inhibition with bafilomycin A1 in control and spastizin (Spg15) mutated cells. (A) L243P, I508N and S1312X spastizin mutated and four different control (one is shown, the others are reported in Supplementary Fig. 7B) lymphoblast cells were incubated with 200 nM bafilomycin A1 in complete medium (unt) or in starvation medium (starv) for 1 h. Total protein extracts were run on 12% SDS-polyacrylamide gels and probed with anti LC3B and actin antibodies. Shown is a representative blot out of three reproducible ones. LC3-II levels were quantified and normalized on actin levels. The mean of the four controls is reported in the graph. The graphs show the mean ± SEM of three independent experiments (***P < 0.001). (B) Fibroblast cells from patients carrying R1209fsX and S1312X spastizin mutations and from a control were incubated with 200 nM bafilomycin A1 and processed as in A. The graphs show the mean ± SEM of three independent experiments (***P < 0.001). (C) HeLa cells were transfected with ZFYVE26 (Spg15) short hairpin RNA or with a control vector (ctr) and 72 h later were incubated with Bafilomycin A1 as described above. Total extracts were probed with anti-LC3B, -actin and -spastizin antibodies, the latter to show the residual spastizin levels in ZFYVE26 (Spg15) short hairpin RNA-transfected cells. Shown is a representative of three reproducible blots.
Figure 10
Figure 10
Spastizin depletion induces accumulation of autophagosomes in primary hippocampal neurons. Primary hippocampal neurons were transfected with MAP1LC3B-RFP for the staining of autophagosomal vesicles (red) and with a control vector (ctr) or with two specific Zfyve26 (Spg15) short hairpin RNAs (shRNA1 and shRNA2) to silence the gene, all with a GFP tag. Seventy-two hours later neurons were starved with Dulbecco’s modified Eagle’s medium for 4 h and fixed. LC3-positive vesicles quantification is shown in the graph. The graphs show the mean ± SEM of three independent experiments for a total of at least 30 cells for each sample (***P < 0.001). Scale bar = 10 µm.
Figure 11
Figure 11
Spastizin mutations induce a reduction of autophagosome-lysosomes fusion. Control (ctr) and L243P, R1209fsX and S1312X spastizin mutated fibroblast cells were transfected with MAP1LC3B-RFP for the staining of autophagosomes (red) and 24 h later were fixed and immunostained with anti-LAMP1 (green) antibody. Yellow in the merge images indicates co-localization of LC3 and LAMP1. Control fibroblast were transfected with two different ZFYVE26 (Spg15) silencing vectors (shRNA1 or shRNA2), showing similar silencing efficiency, both with a GFP tag (green) and with MAP1LC3B-RFP for the staining of autophagosomes (red). Forty-eight hours later cells were fixed and immunostained with anti-LAMP1 (blue) antibody. Violet in the merge indicates co-localization. Pearson’s correlation coefficient for LC3 and LAMP1 co-localization were determined using Volocity software and normalized on that of control cells. The graphs show the mean ± SEM of three independent experiments for a total of at least 30 cells for each sample (***P < 0.001). LC3-positive vesicles quantification is shown in the small graph on the right. Scale bar = 10 µm.
Figure 12
Figure 12
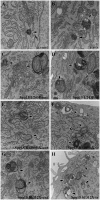
Accumulation of autophagosomes in spastizin mutated fibroblast cells. Control, L243P, R1209fsX and S1312X spastizin mutated fibroblast cells were starved with Earle’s Balanced Salt Solution for 30 min (tr; B, D, F, H) or untreated (unt; A, C, E, G) and processed by electron microscopy. In contrast to control cells, which contain lysosomes (A and B, arrowheads) and few autophagosomes (B, arrow), L243P, R1209fsX and S1312X cells exhibited an increased number of autophagosomes (C–H, arrows).

Similar articles

Cited by

References

    1. Abounit K, Scarabelli TM, McCauley RB. Autophagy in mammalian cells. World J Biol Chem. 2012;3:1–6. - PMC - PubMed
    1. Banerjee R, Beal MF, Thomas B. Autophagy in neurodegenerative disorders: pathogenic roles and therapeutic implications [review] Trends Neurosci. 2010;33:541–9. - PMC - PubMed
    1. Blackstone C, O’Kane CJ, Reid E. Hereditary spastic paraplegias: membrane traffic and the motor pathway [review] Nat Rev Neurosci. 2011;12:31–42. - PMC - PubMed
    1. Boland B, Nixon RA. Neuronal macroautophagy: from development to degeneration. Mol Aspects Med. 2006;27:503–19. - PubMed
    1. Boukhris A, Stevanin G, Feki I, Denora P, Elleuch N, Miladi MI, et al. Tunisian hereditary spastic paraplegias: clinical variability supported by genetic heterogeneity. Clin Genet. 2009;75:527–36. - PubMed

Publication types