. 2010 Jul 15;19(14):2817-27.
doi: 10.1093/hmg/ddq182. Epub 2010 May 12.

TUBA1A mutations cause wide spectrum lissencephaly (smooth brain) and suggest that multiple neuronal migration pathways converge on alpha tubulins

Affiliations

TUBA1A mutations cause wide spectrum lissencephaly (smooth brain) and suggest that multiple neuronal migration pathways converge on alpha tubulins

Ravinesh A Kumar et al. Hum Mol Genet. .

Abstract

We previously showed that mutations in LIS1 and DCX account for approximately 85% of patients with the classic form of lissencephaly (LIS). Some rare forms of LIS are associated with a disproportionately small cerebellum, referred to as lissencephaly with cerebellar hypoplasia (LCH). Tubulin alpha1A (TUBA1A), encoding a critical structural subunit of microtubules, has recently been implicated in LIS. Here, we screen the largest cohort of unexplained LIS patients examined to date to determine: (i) the frequency of TUBA1A mutations in patients with lissencephaly, (ii) the spectrum of phenotypes associated with TUBA1A mutations and (iii) the functional consequences of different TUBA1A mutations on microtubule function. We identified novel and recurrent TUBA1A mutations in approximately 1% of children with classic LIS and in approximately 30% of children with LCH, making this the first major gene associated with the rare LCH phenotype. We also unexpectedly found a TUBA1A mutation in one child with agenesis of the corpus callosum and cerebellar hypoplasia without LIS. Thus, our data demonstrate a wider spectrum of phenotypes than previously reported and allow us to propose new recommendations for clinical testing. We also provide cellular and structural data suggesting that LIS-associated mutations of TUBA1A operate via diverse mechanisms that include disruption of binding sites for microtubule-associated proteins (MAPs).


Figures

Figure 1.
Figure 1.
Intermediate severity LIS identical to the LIS1-associated phenotype in group 1. In this and other brain imaging figures, each row shows multiple images from the same patient. The columns contain midline sagittal (far left column) and parasagittal (second column) images, axial images through the deep nuclei (center column) and bodies of the lateral ventricles (fourth column) and coronal images through the hippocampus (far right column). When coronal images were not available, low axial images through the cerebellum are shown instead. The horizontal white lines in the low posterior fossa in the midline sagittal images (left column) indicate the expected level of the lower border of the vermis at the level of the obex. A set of normal control images is shown in the top row of Supplementary Material, Figure S1. This figure shows three group 1 patients with the recurrent p.R402C TUBA1A mutation. All three have frontal pachygyria and posterior agyria consistent with classic LIS grade 3 and a posterior more severe than anterior (p > a) gradient. Other features include dysmorphic corpus callosum with small rostrum and genu plus a flattened anterior body, poorly myelinated and so unseen internal capsules and round hippocampi with thick leaves [black arrowheads in (E), (J) and (O)]. One patient also has a mildly small cerebellar vermis [space between horizontal white line and lower border of vermis in (A)]. This appearance is essentially identical to patients with heterozygous LIS1 null mutations and deletions. In addition, the tectum appears mildly enlarged (arrowheads in (A), (F) and (K), which differs from other types of LIS. These images come from subjects LP95-073 (A–E), LR07-008 (F–J) and LR08-035 (K–O).
Figure 2.
Figure 2.
Severe LIS resembling MDS in group 2. This figure shows two group 2 patients with the recurrent p.R402H TUBA1A mutation. Both have nearly complete agyria consistent with classic LIS grade 1. Both also have dysmorphic corpus callosum with small rostrum–genu and flat anterior body and poorly myelinated and so unseen internal capsules. The tectum again appears mildly enlarged [arrowheads in (A) and (F)], and both have a small cerebellar vermis [note horizontal white line well below the lower border of the vermis in (A) and (F)]. The gyral malformation is essentially identical to MDS (due to deletion 17p13.3 that includes both LIS1 and YWHAE), while the cerebellar hypoplasia is more severe than most—but not all—children with MDS. These images come from subjects LP97-039 (A–D) and LP97-041 (F–J).
Figure 3.
Figure 3.
A novel and distinctive pattern of LCH in group 3. This figure shows three group 3 patients with TUBA1A missense mutations and a novel pattern of malformations. All three have diffuse pachygyria or LIS grade 4 that appears mildly asymmetric and most severe over the central (mid- and posterior frontal, perisylvian and anterior parietal) regions rather than over the posterior pole. One patient has a prominent layer of gray matter beneath the right perisylvian region [arrow in (N)] that resembles SBH, but the overlying cortex appears thick so this is not true SBH. The hippocampi appear small and abnormally open and round with thick leaves [arrowheads in (E) and (J)]. The basal ganglia are malformed, appearing as large round structures in which the caudate, putamen and globus pallidus cannot be distinguished [asterisks in (C), (H) and (M)]. In the top row, the left basal ganglia appear to be located lateral rather than medial to the frontal horn [asterisk in (C)]. Associated malformations include complete (A and K) or nearly complete (F) ACC, thin brainstem with flat pons [arrows in (A), (F) and (K)], enlarged tectum [arrowheads in (A), (F) and (K)] and small cerebellar vermis [large space between the lower vermis and white lines in (A), (F) and (K)]. The cerebellar hemispheres are mildly small as well (O). These images come from subjects LR05-052 (A–E), LR08-340 (F–J) and LR07-244 (K–O).
Figure 4.
Figure 4.
Group 4 consists of severe LCH. This figure shows three group 4 patients with heterogeneous TUBA1A missense mutations and the most severe form of LCH. All three have a low forehead indicating microcephaly, marked thinning of the cortex and white matter with severe ventriculomegaly and nearly complete agyria except for very limited pachygyria over the frontal poles. However, the appearance of the cerebral cortex differs between the three patients. In the first patient, the ventriculomegaly is severe and the cerebral wall including the cortex is abnormally thin. In the first and third, the cortex is thick with a smooth lower border [arrows in (C), (D), (N)]. In the second, the cortex is thick with an undulating almost sinusoidal lower border [arrows in (H) and (I)]. Compare this pattern with subject LP99-059 shown in Fig. 6F in a prior publication (5). The hippocampi are very small and globular [arrowheads in (E), (J) and (O)]. The basal ganglia are very small and dysplastic with no differentiation between caudate, putamen and globus pallidus [asterisks in (C), (H) and (M)]. Other changes are also severe, including complete ACC, very thin brainstem with flat pons [arrows in (A), (F) and (K)], enlarged tectum [arrowheads in (A), (F) and (K)], severe diffuse cerebellar hypoplasia [large space between lower border of the vermis and white line in (A), (F) and (K)] and relatively enlarged posterior fossa. These overlapping patterns correspond to our prior LCH groups c and f (5). These images come from subjects LR05-388 (A–E), LR07-213 (F–J), and LR08-388 (K–O).
Figure 5.
Figure 5.
Recombinant wild-type and mutant FLAG-tagged TUBA1A incorporate into the normal interphase microtubule network. After transfection into P19 cells, wild-type and mutant recombinant TUBA1A were visualized using methanol fixation and immunostaining using anti-FLAG antibodies.
Figure 6.
Figure 6.
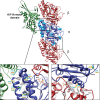
Mapping of TUBA1A mutations onto the 3D structure of kinesin KIF1A–microtubule complex. The KIF1A/microtubule complex: α-tubulin is shown in blue ribbons, β-tubulin in dark and KIF1A in green [PDB ID: 2HXF (33)]. Residues mutated in TUBA1A are shown as light blue spheres; ADP and ATP molecules in stick representation. Substitutions R402H/R402C, S419L, R422H/R422C, L397P and M425K on α-helices H11–H12 are likely to affect H11–H12 interactions, position, orientation and interactions with tubulin-binding proteins (e.g. KIF1A, DCX, MAP2c and Dynein). The guanidinium ion of R402 is involved in a cation–π interaction with the aromatic ring of TUBA1A residue Y399, which in turn forms an H bond with S419-Oγ. Both the R402H and R402C mutations will abolish the cation–π interaction, since neither histidine nor cysteine can be involved in this type of interaction. Because a leucine side chain cannot form an H bond, the S419L mutation cannot stabilize Y399 in the ideal position to form the cation–π interaction with R402. The guanidinium ion of R422 forms multiple H bonds with the carboxylate group of D396 and a salt bridge with the carboxylate group of D392. Neither the R422C nor R422H mutations can participate in these interactions (although histidine is able to form an H bond, it is too far from D396). The M425K mutation might also interrupt this network by competing with R422 for the interaction with D392 (due to a change from a neutral residue to a positively charged one). The L397P mutation is expected to introduce a kink in H11, which will affect the position of D396 and D392 relative to R422. C: The N329S mutation is located on α-helix H10 at the interface between α - and β-tubulin subunits, close to the GTP binding site. The interaction of H10 with α-tubulin is stabilized by the side chains of residues N329 and K326. The N329 forms two H bonds, one with D179 and the other with V177. The N329S mutation will not allow the forming of the H bonds with V177 and therefore is likely to destabilize interactions at the α–β interface. H bonds are marked in black and salt bridges in gray.

Similar articles

Cited by

References

    1. Dobyns W.B., Truwit C.L., Ross M.E., Matsumoto N., Pilz D.T., Ledbetter D.H., Gleeson J.G., Walsh C.A., Barkovich A.J. Differences in the gyral pattern distinguish chromosome 17-linked and X-linked lissencephaly. Neurology. 1999;53:270–277. - PubMed
    1. Pilz D.T., Macha M.E., Precht K.S., Smith A.C., Dobyns W.B., Ledbetter D.H. Fluorescence in situ hybridization analysis with LIS1 specific probes reveals a high deletion mutation rate in isolated lissencephaly sequence. Genet. Med. 1998;1:29–33. - PubMed
    1. Pilz D.T., Matsumoto N., Minnerath S., Mills P., Gleeson J.G., Allen K.M., Walsh C.A., Barkovich A.J., Dobyns W.B., Ledbetter D.H., et al. LIS1 and XLIS (DCX) mutations cause most classical lissencephaly, but different patterns of malformation. Hum. Mol. Genet. 1998;7:2029–2037. doi:10.1093/hmg/7.13.2029. - DOI - PubMed
    1. Forman M.S., Squier W., Dobyns W.B., Golden J.A. Genotypically defined lissencephalies show distinct pathologies. J. Neuropathol. Exp. Neurol. 2005;64:847–857. doi:10.1097/01.jnen.0000182978.56612.41. - DOI - PubMed
    1. Ross M.E., Swanson K., Dobyns W.B. Lissencephaly with cerebellar hypoplasia (LCH): a heterogeneous group of cortical malformations. Neuropediatrics. 2001;32:256–263. doi:10.1055/s-2001-19120. - DOI - PubMed

MeSH terms