Estimating prokaryotic diversity and its limits
- PMID: 12097644
- PMCID: PMC124953
- DOI: 10.1073/pnas.142680199
Estimating prokaryotic diversity and its limits
Abstract
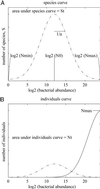
The absolute diversity of prokaryotes is widely held to be unknown and unknowable at any scale in any environment. However, it is not necessary to count every species in a community to estimate the number of different taxa therein. It is sufficient to estimate the area under the species abundance curve for that environment. Log-normal species abundance curves are thought to characterize communities, such as bacteria, which exhibit highly dynamic and random growth. Thus, we are able to show that the diversity of prokaryotic communities may be related to the ratio of two measurable variables: the total number of individuals in the community and the abundance of the most abundant members of that community. We assume that either the least abundant species has an abundance of 1 or Preston's canonical hypothesis is valid. Consequently, we can estimate the bacterial diversity on a small scale (oceans 160 per ml; soil 6,400-38,000 per g; sewage works 70 per ml). We are also able to speculate about diversity at a larger scale, thus the entire bacterial diversity of the sea may be unlikely to exceed 2 x 10(6), while a ton of soil could contain 4 x 10(6) different taxa. These are preliminary estimates that may change as we gain a greater understanding of the nature of prokaryotic species abundance curves. Nevertheless, it is evident that local and global prokaryotic diversity can be understood through species abundance curves and purely experimental approaches to solving this conundrum will be fruitless.
Figures


Comment in
-
How many species of prokaryotes are there?Proc Natl Acad Sci U S A. 2002 Aug 6;99(16):10234-6. doi: 10.1073/pnas.162359199. Epub 2002 Jul 30. Proc Natl Acad Sci U S A. 2002. PMID: 12149517 Free PMC article. Review. No abstract available.
Similar articles
-
How many species of prokaryotes are there?Proc Natl Acad Sci U S A. 2002 Aug 6;99(16):10234-6. doi: 10.1073/pnas.162359199. Epub 2002 Jul 30. Proc Natl Acad Sci U S A. 2002. PMID: 12149517 Free PMC article. Review. No abstract available.
-
Ecology of the rare microbial biosphere of the Arctic Ocean.Proc Natl Acad Sci U S A. 2009 Dec 29;106(52):22427-32. doi: 10.1073/pnas.0908284106. Epub 2009 Dec 17. Proc Natl Acad Sci U S A. 2009. PMID: 20018741 Free PMC article.
-
Incorporating 16S gene copy number information improves estimates of microbial diversity and abundance.PLoS Comput Biol. 2012;8(10):e1002743. doi: 10.1371/journal.pcbi.1002743. Epub 2012 Oct 25. PLoS Comput Biol. 2012. PMID: 23133348 Free PMC article.
-
Comparison of Prokaryotic Diversity in Cold, Oligotrophic Remote Lakes of Chilean Patagonia.Curr Microbiol. 2017 May;74(5):598-613. doi: 10.1007/s00284-017-1209-y. Epub 2017 Mar 7. Curr Microbiol. 2017. PMID: 28265709
-
Prokaryotic diversity and its limits: microbial community structure in nature and implications for microbial ecology.Curr Opin Microbiol. 2004 Jun;7(3):221-6. doi: 10.1016/j.mib.2004.04.010. Curr Opin Microbiol. 2004. PMID: 15196488 Review.
Cited by
-
Amplification by PCR artificially reduces the proportion of the rare biosphere in microbial communities.PLoS One. 2012;7(1):e29973. doi: 10.1371/journal.pone.0029973. Epub 2012 Jan 11. PLoS One. 2012. PMID: 22253843 Free PMC article.
-
Systematic and biotechnological aspects of halophilic and halotolerant actinomycetes.Extremophiles. 2013 Jan;17(1):1-13. doi: 10.1007/s00792-012-0493-5. Epub 2012 Nov 6. Extremophiles. 2013. PMID: 23129307
-
Phylogenetically diverse denitrifying and ammonia-oxidizing bacteria in corals Alcyonium gracillimum and Tubastraea coccinea.Mar Biotechnol (NY). 2013 Oct;15(5):540-51. doi: 10.1007/s10126-013-9503-6. Epub 2013 Apr 6. Mar Biotechnol (NY). 2013. PMID: 23564007
-
Phylogeny-aware identification and correction of taxonomically mislabeled sequences.Nucleic Acids Res. 2016 Jun 20;44(11):5022-33. doi: 10.1093/nar/gkw396. Epub 2016 May 10. Nucleic Acids Res. 2016. PMID: 27166378 Free PMC article.
-
Innovations to culturing the uncultured microbial majority.Nat Rev Microbiol. 2021 Apr;19(4):225-240. doi: 10.1038/s41579-020-00458-8. Epub 2020 Oct 22. Nat Rev Microbiol. 2021. PMID: 33093661 Review.
References
-
- Wilson E. O., (1994) The Diversity of Life (Penguin, New York).
-
- Fenchel T., Esteban, G. F. & Finlay, B. J. (1997) Oikos 80, 220-225.
-
- Finlay B. J. & Clarke, K. J. (1999) Nature (London) 400, 828-828.
MeSH terms
Substances
LinkOut - more resources
Full Text Sources
Other Literature Sources

