Antifungal mechanism of cell-free supernatant produced by Trichoderma virens and its efficacy for the control of pear Valsa canker
- PMID: 38694806
- PMCID: PMC11061385
- DOI: 10.3389/fmicb.2024.1377683
Antifungal mechanism of cell-free supernatant produced by Trichoderma virens and its efficacy for the control of pear Valsa canker
Abstract
Introduction: Pear Valsa canker, caused by Valsa pyri (V. pyri), poses a major threat to pear production. We aimed to assess the effectiveness of the cell-free supernatant (CFS) produced by Trichoderma virens (T. virens) to control the development of pear Valsa canker and reveal the inhibitory mechanism against the pathogenic fungi.
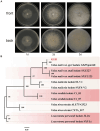
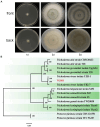
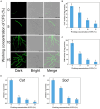
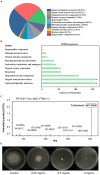
Results: Using morphological characteristics and phylogenetic analysis, the pathogen G1H was identified as V. pyri, and the biocontrol fungus WJ561 was identified as Trichoderma virens. CFS derived from WJ561 exhibited strong inhibition of mycelial growth and was capable of reducing the pathogenicity of V. pyri on pear leaves and twigs. Scanning electron microscopy (SEM) observations revealed deformations and shrinkages in the fungal hyphae treated with CFS. The CFS also destroyed the hyphal membranes leading to the leakage of cellular contents and an increase in the malondialdehyde (MDA) content. Additionally, CFS significantly inhibited the activities of catalase (CAT) and superoxide dismutase (SOD), and downregulated the expression of antioxidant defense-related genes in V. pyri, causing the accumulation of reactive oxygen species (ROS). Artesunate, identified as the main component in CFS by liquid chromatograph-mass spectrometry (LC-MS), exhibited antifungal activity against V. pyri.
Conclusion: Our findings demonstrate the promising potential of T. virens and its CFS in controlling pear Valsa canker. The primary inhibitory mechanism of CFS involves multiple processes, including membrane damage and negatively affecting enzymatic detoxification pathways, consequently leading to hyphal oxidative damage of V. pyri. This study lays a theoretical foundation for the utilization of T. virens to control V. pyri in practical production.
Keywords: Trichoderma virens; Valsa pyri; antifungal activity; cell-free supernatant; reactive oxygen species.
Copyright © 2024 Zhang, Lu, Jin, Li, Wu and He.
Conflict of interest statement
The authors declare that the research was conducted in the absence of any commercial or financial relationships that could be construed as a potential conflict of interest.
Figures


Similar articles
-
First report of Diaporthe caulivora causing Phomopsis stem canker on sunflower (Helianthus annuus L.) in Minnesota.Plant Dis. 2024 Dec 9. doi: 10.1094/PDIS-10-24-2068-PDN. Online ahead of print. Plant Dis. 2024. PMID: 39652790
-
Depressing time: Waiting, melancholia, and the psychoanalytic practice of care.In: Kirtsoglou E, Simpson B, editors. The Time of Anthropology: Studies of Contemporary Chronopolitics. Abingdon: Routledge; 2020. Chapter 5. In: Kirtsoglou E, Simpson B, editors. The Time of Anthropology: Studies of Contemporary Chronopolitics. Abingdon: Routledge; 2020. Chapter 5. PMID: 36137063 Free Books & Documents. Review.
-
First report of leaf brown spot caused by Diaporthe phoenicicola on Lithocarpus polystachyus in China.Plant Dis. 2024 Dec 10. doi: 10.1094/PDIS-04-24-0846-PDN. Online ahead of print. Plant Dis. 2024. PMID: 39659065
-
Public engagement to refine a whole-school intervention to promote adolescent mental health.Public Health Res (Southampt). 2024 Dec 4:1-22. doi: 10.3310/JWGT4863. Online ahead of print. Public Health Res (Southampt). 2024. PMID: 39636228
-
The effectiveness of abstinence-based and harm reduction-based interventions in reducing problematic substance use in adults who are experiencing homelessness in high income countries: A systematic review and meta-analysis: A systematic review.Campbell Syst Rev. 2024 Apr 21;20(2):e1396. doi: 10.1002/cl2.1396. eCollection 2024 Jun. Campbell Syst Rev. 2024. PMID: 38645303 Free PMC article. Review.
References
-
- Abe K., Kotoda N., Kato H., Soejima J. (2007). Resistance sources to Valsa canker (Valsa Ceratosperma) in a germplasm collection of diverse Malus species. Plant Breed. 126, 449–453. doi: 10.1111/j.1439-0523.2007.01379.x - DOI
-
- Barman M., Dandasena D., Suresh A., Bhandari V., Kamble S., Singh S., et al. . (2023). Artemisinin derivatives induce oxidative stress leading to DNA damage and caspase-mediated apoptosis in Theileria Annulata-transformed cells. Cell Commun. Signal. 21, 1–15. doi: 10.1186/s12964-023-01067-7, PMID: - DOI - PMC - PubMed
-
- Boukaew S., Zhang Z., Prasertsan P., Igarashi Y. (2023). Antifungal and Antiaflatoxigenic mechanism activity of freeze-dried culture filtrate of Streptomyces Philanthi Rl-1-178 on the two Aflatoxigenic Fungi and identification of its active component. J. Appl. Microbiol. 134, 1–9. doi: 10.1093/jambio/lxac091, PMID: - DOI - PubMed
Grants and funding
LinkOut - more resources
Full Text Sources
Miscellaneous

