Functional analysis and validation of oncodrive gene AP3S1 in ovarian cancer through filtering of mutation data from whole-exome sequencing
- PMID: 38609993
- PMCID: PMC11015698
- DOI: 10.1186/s40001-024-01814-7
Functional analysis and validation of oncodrive gene AP3S1 in ovarian cancer through filtering of mutation data from whole-exome sequencing
Abstract
Background: High-grade serous ovarian carcinoma (HGSOC) is the most aggressive and prevalent subtype of ovarian cancer and accounts for a significant portion of ovarian cancer-related deaths worldwide. Despite advancements in cancer treatment, the overall survival rate for HGSOC patients remains low, thus highlighting the urgent need for a deeper understanding of the molecular mechanisms driving tumorigenesis and for identifying potential therapeutic targets. Whole-exome sequencing (WES) has emerged as a powerful tool for identifying somatic mutations and alterations across the entire exome, thus providing valuable insights into the genetic drivers and molecular pathways underlying cancer development and progression.
Methods: Via the analysis of whole-exome sequencing results of tumor samples from 90 ovarian cancer patients, we compared the mutational landscape of ovarian cancer patients with that of TCGA patients to identify similarities and differences. The sequencing data were subjected to bioinformatics analysis to explore tumor driver genes and their functional roles. Furthermore, we conducted basic medical experiments to validate the results obtained from the bioinformatics analysis.
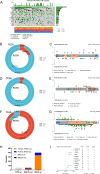
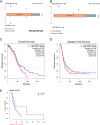
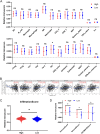
Results: Whole-exome sequencing revealed the mutational profile of HGSOC, including BRCA1, BRCA2 and TP53 mutations. AP3S1 emerged as the most weighted tumor driver gene. Further analysis of AP3S1 mutations and expression demonstrated their associations with patient survival and the tumor immune response. AP3S1 knockdown experiments in ovarian cancer cells demonstrated its regulatory role in tumor cell migration and invasion through the TGF-β/SMAD pathway.
Conclusion: This comprehensive analysis of somatic mutations in HGSOC provides insight into potential therapeutic targets and molecular pathways for targeted interventions. AP3S1 was identified as being a key player in tumor immunity and prognosis, thus providing new perspectives for personalized treatment strategies. The findings of this study contribute to the understanding of HGSOC pathogenesis and provide a foundation for improved outcomes in patients with this aggressive disease.
Keywords: AP3S1; EMT; Immune infiltration; Ovarian cancer; Somatic mutation; TGF-β pathway.
© 2024. The Author(s).
Conflict of interest statement
The authors have no competing interests.
Figures




Similar articles
-
Classification of High-Grade Serous Ovarian Carcinoma by Epithelial-to-Mesenchymal Transition Signature and Homologous Recombination Repair Genes.Genes (Basel). 2021 Jul 20;12(7):1103. doi: 10.3390/genes12071103. Genes (Basel). 2021. PMID: 34356119 Free PMC article.
-
Tumor specific methylome in Chinese high-grade serous ovarian cancer characterized by gene expression profile and tumor genotype.Gynecol Oncol. 2020 Jul;158(1):178-187. doi: 10.1016/j.ygyno.2020.04.688. Epub 2020 May 1. Gynecol Oncol. 2020. PMID: 32362568
-
Somatic Mutational Profile of High-Grade Serous Ovarian Carcinoma and Triple-Negative Breast Carcinoma in Young and Elderly Patients: Similarities and Divergences.Cells. 2021 Dec 20;10(12):3586. doi: 10.3390/cells10123586. Cells. 2021. PMID: 34944094 Free PMC article.
-
High-grade serous ovarian carcinoma, the "Achiles' hill" for clinicians and molecular biologists: a molecular insight.Mol Biol Rep. 2023 Nov;50(11):9511-9519. doi: 10.1007/s11033-023-08760-3. Epub 2023 Sep 22. Mol Biol Rep. 2023. PMID: 37737967 Review.
-
Extracellular matrix in high-grade serous ovarian cancer: Advances in understanding of carcinogenesis and cancer biology.Matrix Biol. 2023 Apr;118:16-46. doi: 10.1016/j.matbio.2023.02.004. Epub 2023 Feb 11. Matrix Biol. 2023. PMID: 36781087 Review.
References
-
- Fucikova J, Palova-Jelinkova L, Klapp V, Holicek P, Lanickova T, Kasikova L, Drozenova J, Cibula D, Alvarez-Abril B, Garcia-Martinez E, et al. Immunological control of ovarian carcinoma by chemotherapy and targeted anticancer agents. Trends Cancer. 2022;8(5):426–444. doi: 10.1016/j.trecan.2022.01.010. - DOI - PubMed
MeSH terms
Grants and funding
LinkOut - more resources
Full Text Sources
Medical
Research Materials
Miscellaneous

