Immune regulation and prognosis indicating ability of a newly constructed multi-genes containing signature in clear cell renal cell carcinoma
- PMID: 37438709
- PMCID: PMC10337188
- DOI: 10.1186/s12885-023-11150-4
Immune regulation and prognosis indicating ability of a newly constructed multi-genes containing signature in clear cell renal cell carcinoma
Abstract
Background: Clear cell renal cell carcinoma (ccRCC) is the most common renal malignancy, although newly developing targeted therapy and immunotherapy have been showing promising effects in clinical treatment, the effective biomarkers for immune response prediction are still lacking. The study is to construct a gene signature according to ccRCC immune cells infiltration landscape, thus aiding clinical prediction of patients response to immunotherapy.
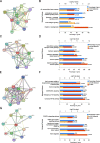
Methods: Firstly, ccRCC transcriptome expression profiles from Gene Expression Omnibus (GEO) database as well as immune related genes information from IMMPORT database were combine applied to identify the differently expressed meanwhile immune related candidate genes in ccRCC comparing to normal control samples. Then, based on protein-protein interaction network (PPI) and following module analysis of the candidate genes, a hub gene cluster was further identified for survival analysis. Further, LASSO analysis was applied to construct a signature which was in succession assessed with Kaplan-Meier survival, Cox regression and ROC curve analysis. Moreover, ccRCC patients were divided as high and low-risk groups based on the gene signature followed by the difference estimation of immune treatment response and exploration of related immune cells infiltration by TIDE and Cibersort analysis respectively among the two groups of patients.
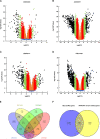
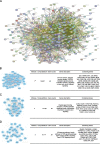
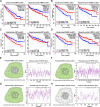
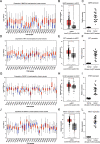
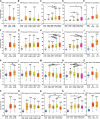
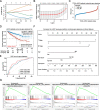
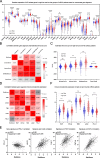
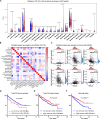
Results: Based on GEO and IMMPORT databases, a total of 269 differently expressed meanwhile immune related genes in ccRCC were identified, further PPI network and module analysis of the 269 genes highlighted a 46 genes cluster. Next step, Kaplan-Meier and Cox regression analysis of the 46 genes identified 4 genes that were supported to be independent prognosis indicators, and a gene signature was constructed based on the 4 genes. Furthermore, after assessing its prognosis indicating ability by both Kaplan-Meier and Cox regression analysis, immune relation of the signature was evaluated including its association with environment immune score, Immune checkpoint inhibitors expression as well as immune cells infiltration. Together, immune predicting ability of the signature was preliminary explored.
Conclusions: Based on ccRCC genes expression profiles and multiple bioinformatic analysis, a 4 genes containing signature was constructed and the immune regulation of the signature was preliminary explored. Although more detailed experiments and clinical trials are needed before potential clinical use of the signature, the results shall provide meaningful insight into further ccRCC immune researches.
Keywords: Clear cell renal cell carcinoma (ccRCC); Gene signature; Immune response; LASSO analysis; Prediction biomarker.
© 2023. The Author(s).
Conflict of interest statement
All of the authors agreed the publication of the paper and declare no conflicts of interests.
Figures
Similar articles
-
Comprehensive analysis of LD-related genes signature for predicting prognosis and immunotherapy response in clear cell renal cell carcinoma.BMC Nephrol. 2024 Sep 10;25(1):298. doi: 10.1186/s12882-024-03735-3. BMC Nephrol. 2024. PMID: 39256647 Free PMC article.
-
Functional enrichment analysis of LYSET and identification of related hub gene signatures as novel biomarkers to predict prognosis and immune infiltration status of clear cell renal cell carcinoma.J Cancer Res Clin Oncol. 2023 Dec;149(18):16905-16929. doi: 10.1007/s00432-023-05280-2. Epub 2023 Sep 23. J Cancer Res Clin Oncol. 2023. PMID: 37740762 Free PMC article.
-
Construction of the metabolic reprogramming-associated gene signature for clear cell renal cell carcinoma prognosis prediction.BMC Urol. 2023 Sep 15;23(1):147. doi: 10.1186/s12894-023-01317-3. BMC Urol. 2023. PMID: 37715154 Free PMC article.
-
Emerging Immunotherapy Approaches for Advanced Clear Cell Renal Cell Carcinoma.Cells. 2023 Dec 22;13(1):34. doi: 10.3390/cells13010034. Cells. 2023. PMID: 38201238 Free PMC article. Review.
-
Genomic Profiling and Molecular Characterization of Clear Cell Renal Cell Carcinoma.Curr Oncol. 2023 Oct 20;30(10):9276-9290. doi: 10.3390/curroncol30100670. Curr Oncol. 2023. PMID: 37887570 Free PMC article. Review.
Cited by
-
Genomic Fabrics of the Excretory System's Functional Pathways Remodeled in Clear Cell Renal Cell Carcinoma.Curr Issues Mol Biol. 2023 Nov 24;45(12):9471-9499. doi: 10.3390/cimb45120594. Curr Issues Mol Biol. 2023. PMID: 38132440 Free PMC article.
References
-
- Browning L, Colling R, Verrill C. WHO/ISUP grading of clear cell renal cell carcinoma and papillary renal cell carcinoma; validation of grading on the digital pathology platform and perspectives on reproducibility of grade. Diagn Pathol. 2021;16(1):75. doi: 10.1186/s13000-021-01130-2. - DOI - PMC - PubMed
-
- Expert Group of G, Urological Pathology CSoP [Recent advances and expert consensus on molecular pathology of renal cell carcinomas (2020 version)] Zhonghua Bing Li Xue Za Zhi. 2020;49(12):1232–1241. - PubMed
-
- Williamson SR, Gill AJ, Argani P, Chen YB, Egevad L, Kristiansen G, Grignon DJ, Hes O. Report from the International Society of Urological Pathology (ISUP) consultation conference on molecular pathology of urogenital cancers: III: molecular pathology of kidney cancer. Am J Surg Pathol. 2020;44(7):e47–e65. doi: 10.1097/PAS.0000000000001476. - DOI - PMC - PubMed
MeSH terms
Grants and funding
LinkOut - more resources
Full Text Sources
Medical

