The normality assumption on between-study random effects was questionable in a considerable number of Cochrane meta-analyses
- PMID: 36978059
- PMCID: PMC10053115
- DOI: 10.1186/s12916-023-02823-9
The normality assumption on between-study random effects was questionable in a considerable number of Cochrane meta-analyses
Abstract
Background: Studies included in a meta-analysis are often heterogeneous. The traditional random-effects models assume their true effects to follow a normal distribution, while it is unclear if this critical assumption is practical. Violations of this between-study normality assumption could lead to problematic meta-analytical conclusions. We aimed to empirically examine if this assumption is valid in published meta-analyses.
Methods: In this cross-sectional study, we collected meta-analyses available in the Cochrane Library with at least 10 studies and with between-study variance estimates > 0. For each extracted meta-analysis, we performed the Shapiro-Wilk (SW) test to quantitatively assess the between-study normality assumption. For binary outcomes, we assessed between-study normality for odds ratios (ORs), relative risks (RRs), and risk differences (RDs). Subgroup analyses based on sample sizes and event rates were used to rule out the potential confounders. In addition, we obtained the quantile-quantile (Q-Q) plot of study-specific standardized residuals for visually assessing between-study normality.
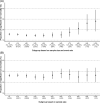
Results: Based on 4234 eligible meta-analyses with binary outcomes and 3433 with non-binary outcomes, the proportion of meta-analyses that had statistically significant non-normality varied from 15.1 to 26.2%. RDs and non-binary outcomes led to more frequent non-normality issues than ORs and RRs. For binary outcomes, the between-study non-normality was more frequently found in meta-analyses with larger sample sizes and event rates away from 0 and 100%. The agreements of assessing the normality between two independent researchers based on Q-Q plots were fair or moderate.
Conclusions: The between-study normality assumption is commonly violated in Cochrane meta-analyses. This assumption should be routinely assessed when performing a meta-analysis. When it may not hold, alternative meta-analysis methods that do not make this assumption should be considered.
Keywords: Cochrane Library; Effect measure; Heterogeneity; Meta-analysis; Normality assumption; Q–Q plot.
© 2023. The Author(s).
Conflict of interest statement
The authors declare that they have no competing interests.
Figures


Similar articles
-
Folic acid supplementation and malaria susceptibility and severity among people taking antifolate antimalarial drugs in endemic areas.Cochrane Database Syst Rev. 2022 Feb 1;2(2022):CD014217. doi: 10.1002/14651858.CD014217. Cochrane Database Syst Rev. 2022. PMID: 36321557 Free PMC article.
-
Evaluation of the Normality Assumption in Meta-Analyses.Am J Epidemiol. 2020 Mar 2;189(3):235-242. doi: 10.1093/aje/kwz261. Am J Epidemiol. 2020. PMID: 31781756
-
Behavioral and Pharmacotherapy Weight Loss Interventions to Prevent Obesity-Related Morbidity and Mortality in Adults: An Updated Systematic Review for the U.S. Preventive Services Task Force [Internet].Rockville (MD): Agency for Healthcare Research and Quality (US); 2018 Sep. Report No.: 18-05239-EF-1. Rockville (MD): Agency for Healthcare Research and Quality (US); 2018 Sep. Report No.: 18-05239-EF-1. PMID: 30354042 Free Books & Documents. Review.
-
Heterogeneity estimation in meta-analysis of standardized mean differences when the distribution of random effects departs from normal: A Monte Carlo simulation study.BMC Med Res Methodol. 2023 Jan 17;23(1):19. doi: 10.1186/s12874-022-01809-0. BMC Med Res Methodol. 2023. PMID: 36650428 Free PMC article.
-
Impact of summer programmes on the outcomes of disadvantaged or 'at risk' young people: A systematic review.Campbell Syst Rev. 2024 Jun 13;20(2):e1406. doi: 10.1002/cl2.1406. eCollection 2024 Jun. Campbell Syst Rev. 2024. PMID: 38873396 Free PMC article. Review.
Cited by
-
A Meta-analysis of Surgical Outcomes of T4a and Infranotch T4b Oral Cancers.Oncol Ther. 2023 Dec;11(4):461-480. doi: 10.1007/s40487-023-00246-3. Epub 2023 Oct 7. Oncol Ther. 2023. PMID: 37804420 Free PMC article. Review.
-
Artificial intelligence in fracture detection with different image modalities and data types: A systematic review and meta-analysis.PLOS Digit Health. 2024 Jan 30;3(1):e0000438. doi: 10.1371/journal.pdig.0000438. eCollection 2024 Jan. PLOS Digit Health. 2024. PMID: 38289965 Free PMC article.
-
Challenges and Concerns in the Utilization of Meta-Analysis Software: Navigating the Landscape of Scientific Synthesis.Cureus. 2024 Jan 31;16(1):e53322. doi: 10.7759/cureus.53322. eCollection 2024 Jan. Cureus. 2024. PMID: 38435898 Free PMC article.
-
Longitudinal Changes in Human Milk Minerals and Vitamins in the Chinese Population: A Scoping Review.Nutrients. 2024 May 30;16(11):1710. doi: 10.3390/nu16111710. Nutrients. 2024. PMID: 38892644 Free PMC article.
-
Evidence of correlations between human partners based on systematic reviews and meta-analyses of 22 traits and UK Biobank analysis of 133 traits.Nat Hum Behav. 2023 Sep;7(9):1568-1583. doi: 10.1038/s41562-023-01672-z. Epub 2023 Aug 31. Nat Hum Behav. 2023. PMID: 37653148 Free PMC article.
References
Publication types
MeSH terms
Grants and funding
LinkOut - more resources
Full Text Sources

