. 2022 Sep 21:10:945586.
doi: 10.3389/fcell.2022.945586. eCollection 2022.

Bioinformatic analysis of the LCN2-SLC22A17-MMP9 network in cancer: The role of DNA methylation in the modulation of tumor microenvironment

Affiliations

Bioinformatic analysis of the LCN2-SLC22A17-MMP9 network in cancer: The role of DNA methylation in the modulation of tumor microenvironment

Saverio Candido et al. Front Cell Dev Biol. .

Abstract

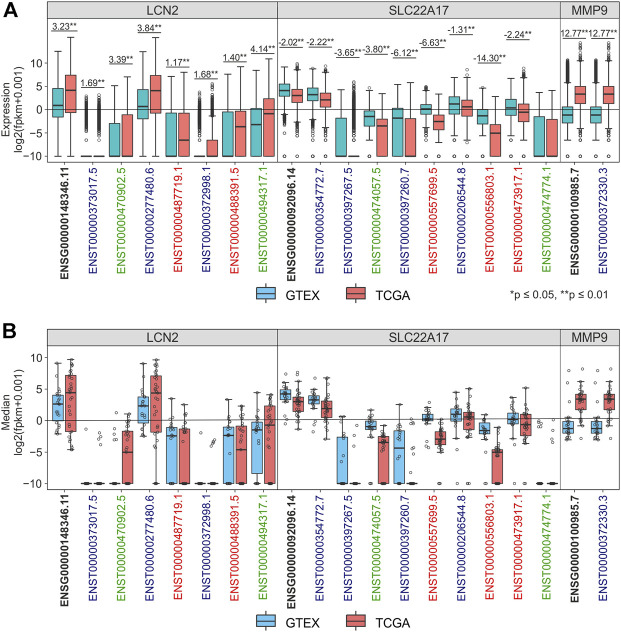
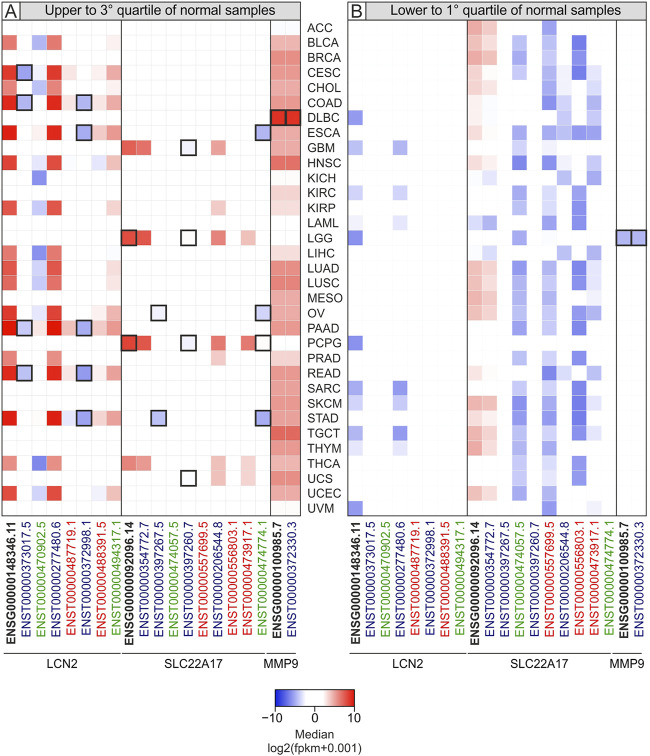
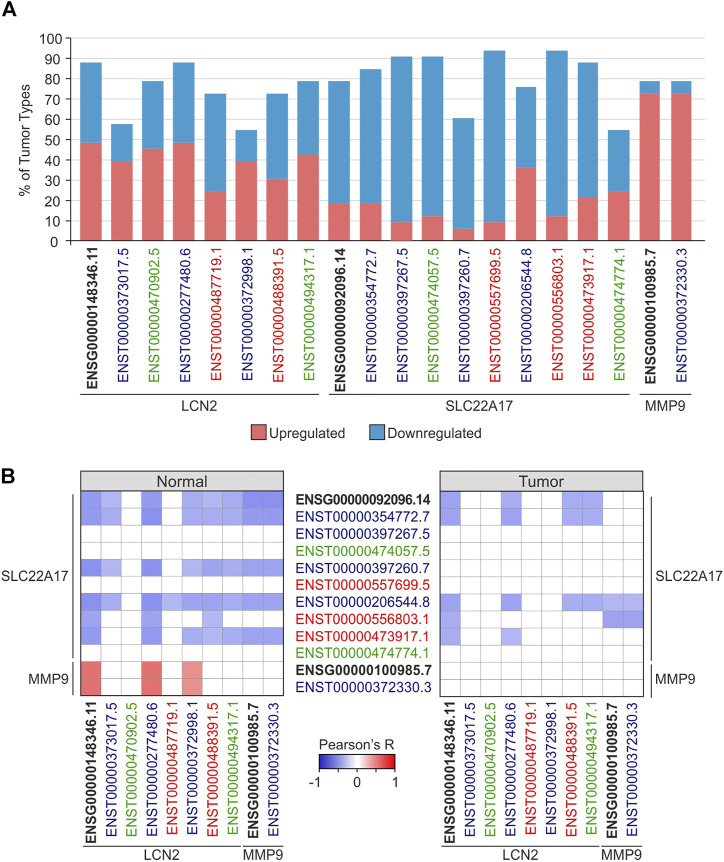
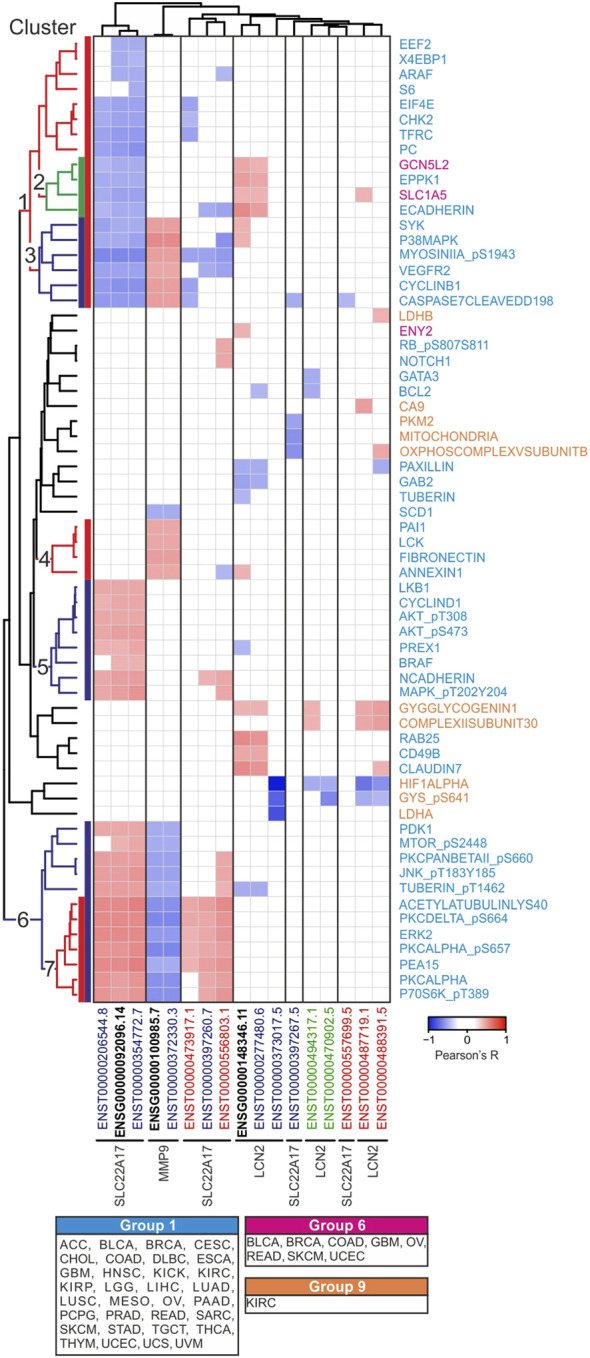
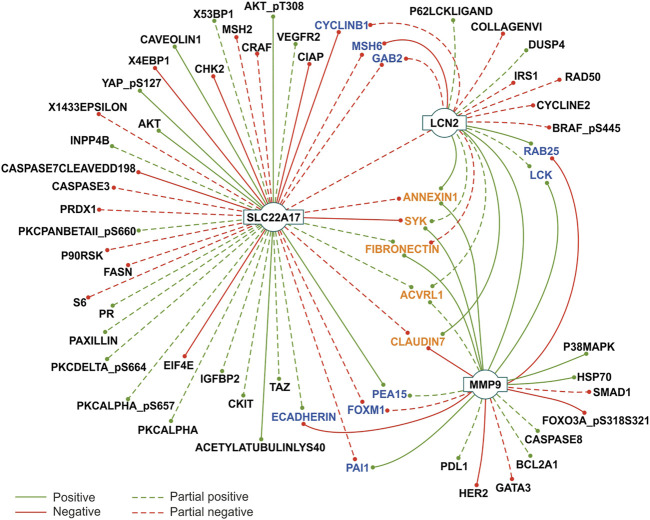
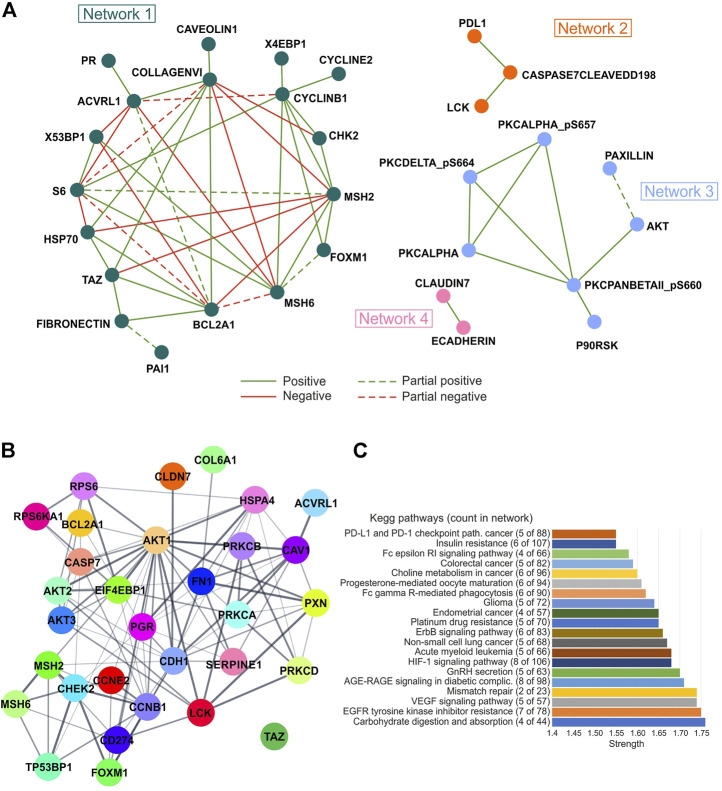
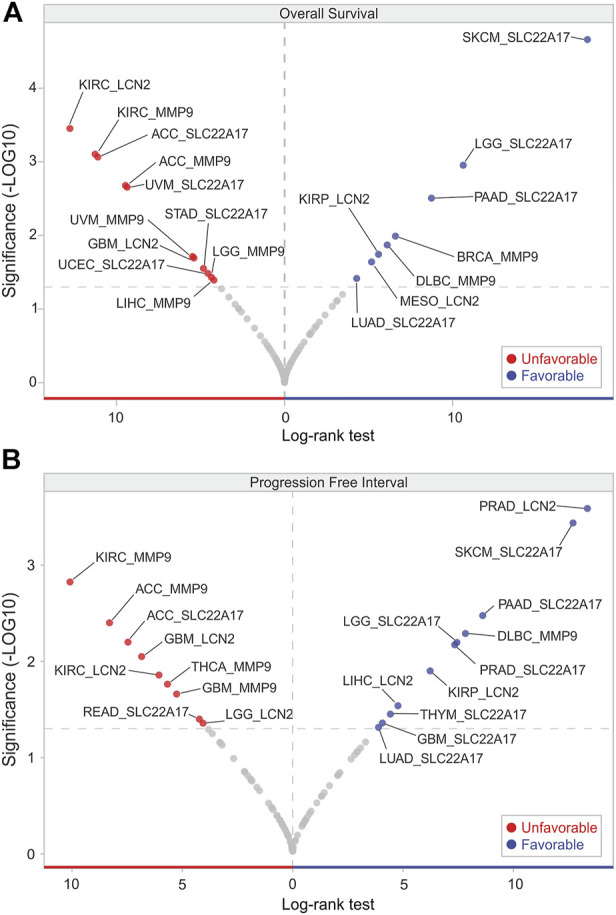
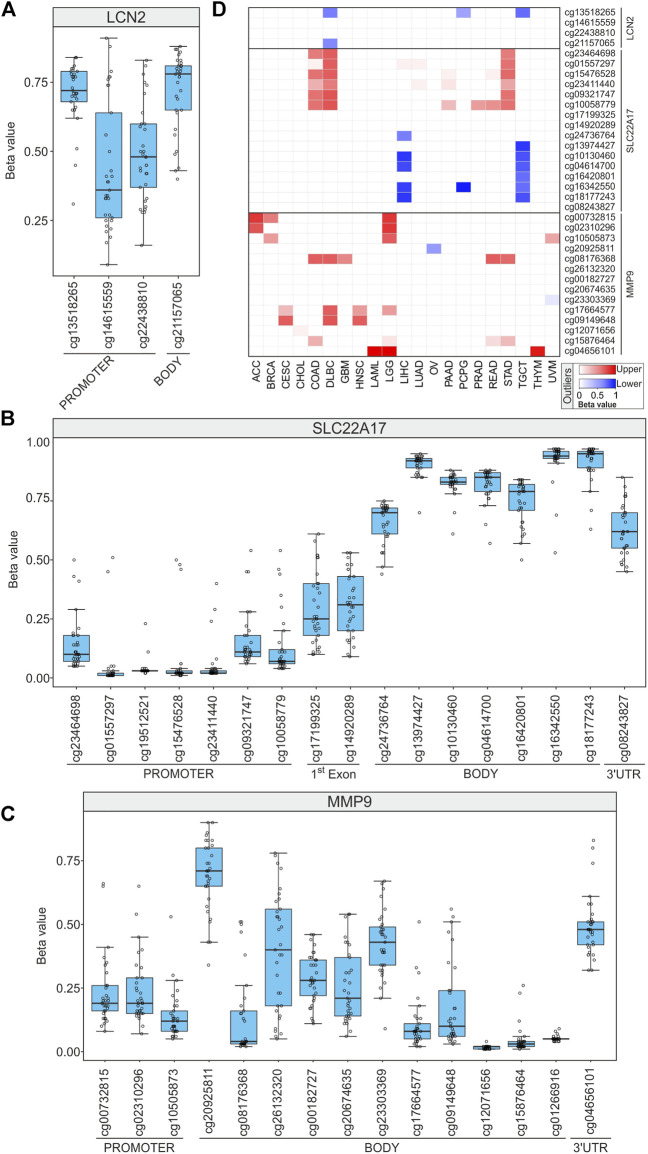
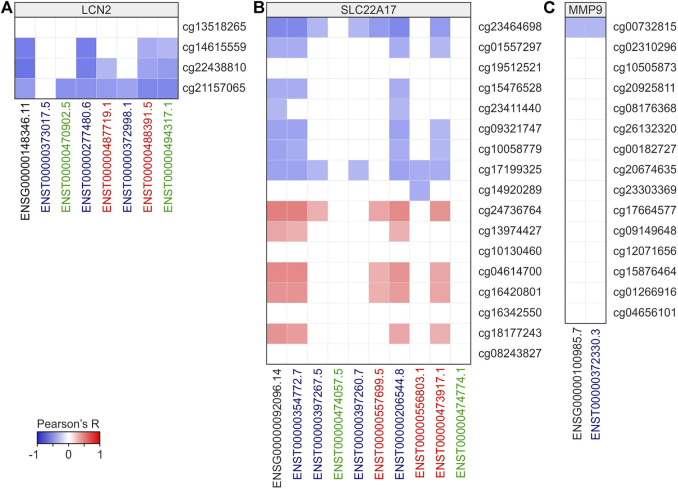
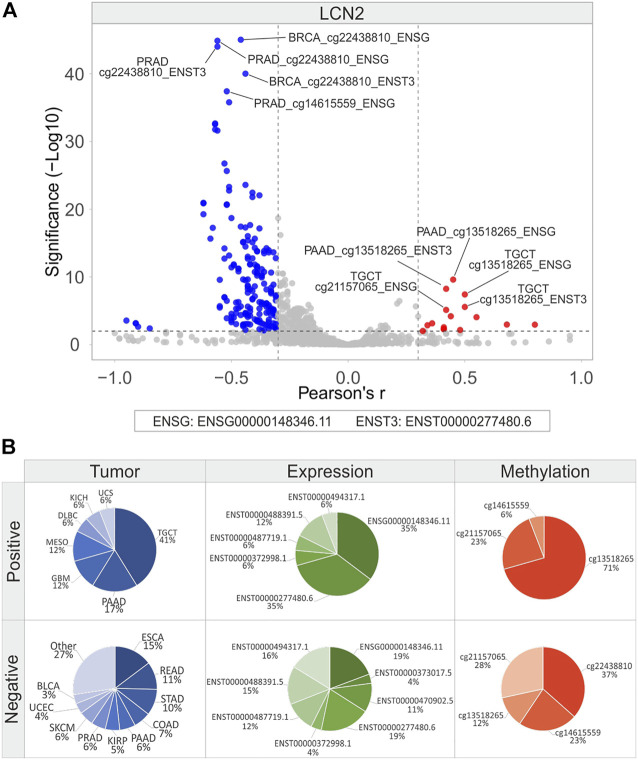
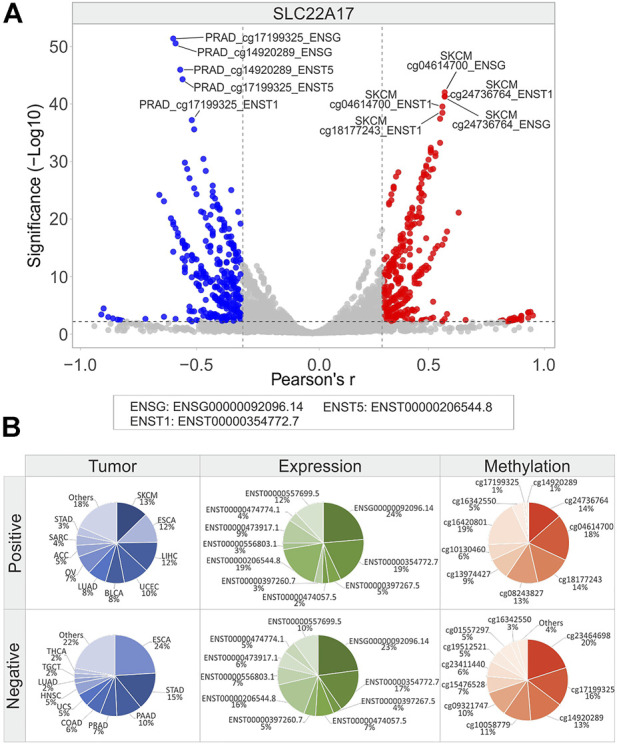
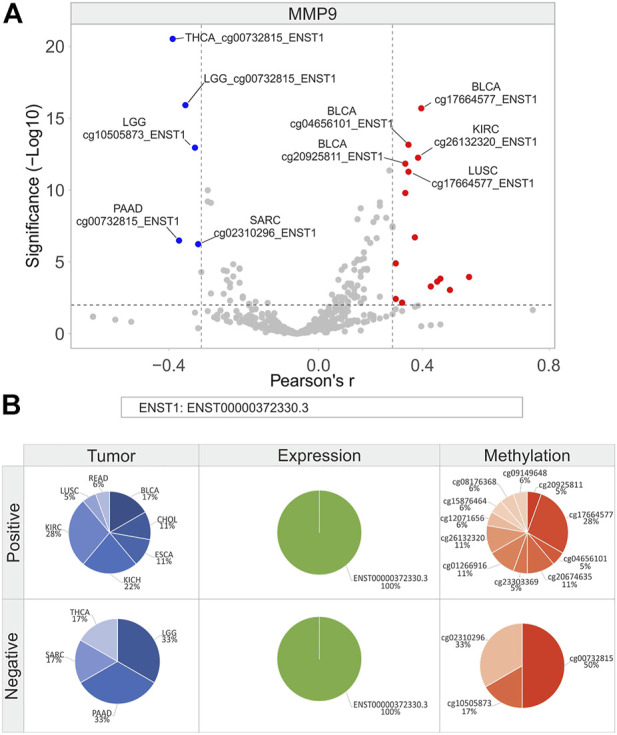
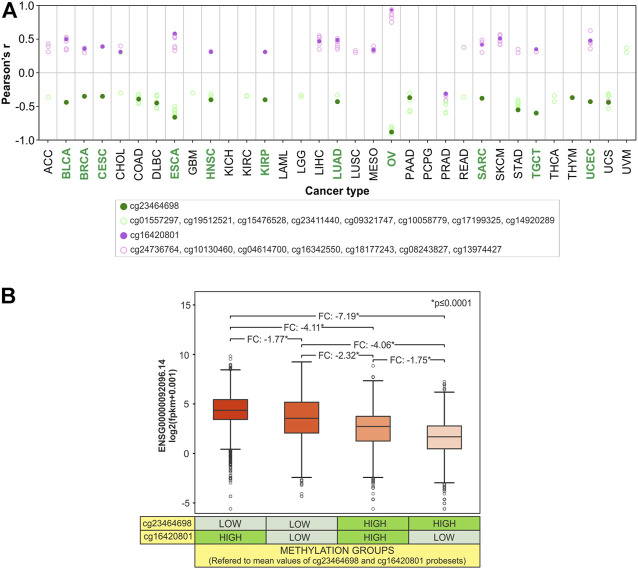
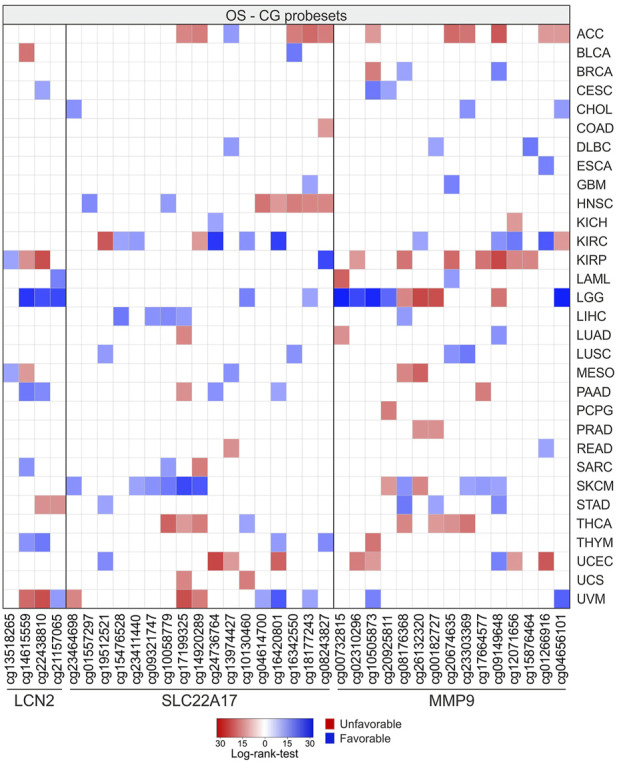
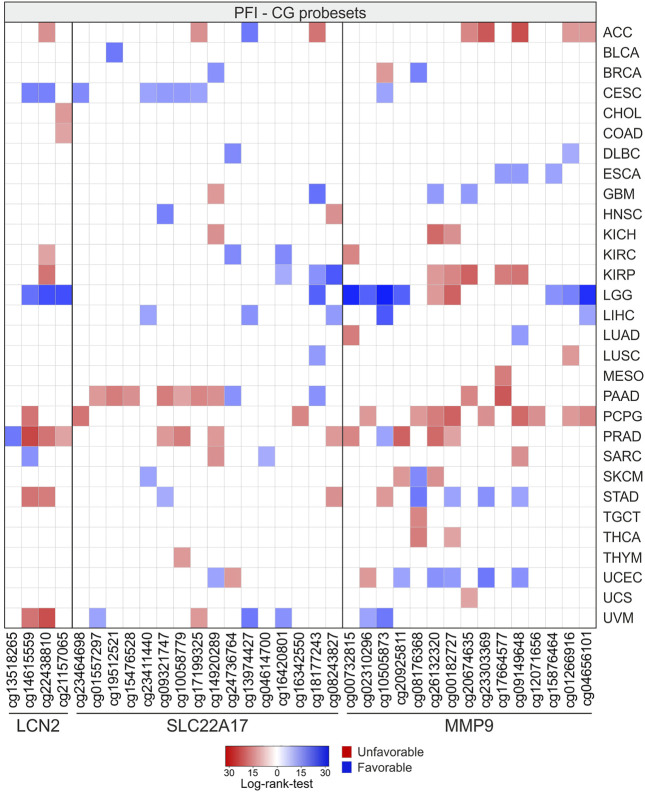
Several features of cancer cells such as proliferation, invasion, metastatic spreading, and drug resistance are affected by their interaction with several tumor microenvironment (TME) components, including neutrophil gelatinase-associated lipocalin (NGAL), solute carrier family 22 member 17 (SLC22A17), and matrix metallopeptidase 9 (MMP9). These molecules play a key role in tumor growth, invasion, and iron-dependent metabolism of cancer cells. However, the precise epigenetic mechanisms underlying the gene regulation of Lipocalin 2 (LCN2), SLC22A17, and MMP9 in cancer still remain unclear. To this purpose, computational analysis was performed on TCGA and GTEx datasets to evaluate the expression and DNA methylation status of LCN2, SLC22A17, and MMP9 genes in different tumor types. Correlation analysis between gene/isoforms expression and DNA methylation levels of LCN2, SLC22A17, and MMP9 was performed to investigate the role of DNA methylation in the modulation of these genes. Protein network analysis was carried out using reverse phase protein arrays (RPPA) data to identify protein-protein interactions of the LCN2-SLC22A17-MMP9 network. Furthermore, survival analysis was performed according to gene expression and DNA methylation levels. Our results demonstrated that LCN2 and MMP9 were mainly upregulated in most tumor types, whereas SLC22A17 was largely downregulated, representing a specific hallmark signature for all gastrointestinal tumors. Notably, the expression of LCN2, SLC22A17, and MMP9 genes was negatively affected by promoter methylation. Conversely, intragenic hypermethylation was associated with the overexpression of SLC22A17 and MMP9 genes. Protein network analysis highlighted the role of the LCN2-SLC22A17-MMP9 network in TME by the interaction with fibronectin 1 and claudin 7, especially in rectal tumors. Moreover, the impact of expression and methylation status of LCN2, SLC22A17, and MMP9 on overall survival and progression free interval was tumor type-dependent. Overall, our analyses provide a detailed overview of the expression and methylation status of LCN2, SLC22A17, and MMP9 in all TCGA tumors, indicating that the LCN2-SLC22A17-MMP9 network was strictly regulated by DNA methylation within TME. Our findings pave the way for the identification of novel DNA methylation hotspots with diagnostic and prognostic values and suitable for epi-drug targeting.

Keywords: DNA methylation; LCN2; MMP9; SLC22A17; bioinformatic; cancer; ferroptosis; gene expression.


Conflict of interest statement

The authors declare that the research was conducted in the absence of any commercial or financial relationships that could be construed as a potential conflict of interest.

Figures

FIGURE 1
FIGURE 1
Differential analysis of LCN2, SLC22A17, and MMP9 expression levels in TCGA tumor and GTEx normal samples. (A) Expression levels of LCN2, SLC22A17, and MMP9 genes and isoforms in normal (blue) and tumor samples (red). Fold Change was reported for each comparing group. (B) Distribution of expression median values calculated for the gene and isoforms (empty circles) is shown for each tumor type and matched normal tissues. Black bold labels indicate the LCN2, SLC22A17, and MMP9 gene expression (ENSG), including all spliced transcripts (ENST). Coding isoforms: blue; non-coding isoforms: green; retained intron isoforms: red.
FIGURE 2
FIGURE 2
Heatmap of median expression levels for LCN2, SLC22A17, and MMP9 genes and isoforms in tumor samples according to interquartile range of normal samples median values. The median values of each tumor type higher than the 3rd quartile (A) or lower than the 1st quartile of normal tissues (B) are reported. The negative median values (lower expression) are shown as blue squares, while positive ones (higher expression) are indicated in red. Black border indicates the median values of each tumor type that are also outliers. Black bold labels indicate the LCN2, SLC22A17, and MMP9 genes (ENSG). Coding ENST isoforms: blue; non-coding ENST isoforms: green; retained intron ENST isoforms: red.
FIGURE 3
FIGURE 3
Expression and correlation analyses of gene (ENSG) and splicing isoforms (ENST) of LCN2, SLC22A17, and MMP9 in normal and tumoral tissues. (A) Percentage of tumor types in which LCN2, SLC22A17, and MMP9 expression levels were up (red) or downregulated (blue) compared to normal tissues. Only tumors showing FC ≥ 1.4 or ≤ −1.4 (p ≤ 0.05) are included in the analysis. (B) Correlation analysis between LCN2, SLC22A17, and MMP9 genes and isoforms expression in normal and tumor samples. Tumor and normal samples were analyzed collectively. Correlation with Pearson’s r ≥ 0.3 or ≤ −0.3 and p ≤ 0.05 were included in the heatmap. Black bold labels indicate the LCN2, SLC22A17, and MMP9 genes (ENSG). Coding ENST isoforms: blue; non-coding ENST isoforms: green; retained intron ENST isoforms: red.
FIGURE 4
FIGURE 4
Correlation analysis between LCN2, SLC22A17, and MMP9 gene/isoforms expression and protein levels in PANCAN tumor samples. Correlation with Pearson’s r ≥ 0.3 or ≤ −0.3 and p ≤ 0.05 are included in the heatmap. The average linkage clustering method and Euclidean distance measurement method were applied for grouping similar data in seven representative clusters. Each protein is labeled with three different colors corresponding to 1, 6, and 9 tumor groups (Supplementary Table S6). Black bold labels indicate the LCN2, SLC22A17, and MMP9 genes (ENSG). Coding ENST isoforms: blue; non-coding ENST isoforms: green; retained intron ENST isoforms: red.
FIGURE 5
FIGURE 5
Correlation analysis between LCN2, SLC22A17, and MMP9 gene expression and protein levels in tumor types. Protein-gene interaction showing correlation (Pearson’s r ≥ 0.3 or ≤ −0.3; p ≤ 0.05) in at least five tumor types are reported. The concordance among Pearson’s values was defined as the degree of agreement among the correlation sign. Partial concordance: dotted interaction lines. Total concordance: solid interaction lines. Proteins interacting with two genes are represented in blue, while proteins interacting with all three genes are represented in orange. The network was obtained from Cytoscape 3.8.2 (https://cytoscape.org/).
FIGURE 6
FIGURE 6
Correlation and pathway analysis of protein levels analyzed in each tumor type. (A) Protein–protein interaction showing correlation (Pearson’s r ≥ 0.3 or ≤ −0.3; p ≤ 0.05) in at least 20 tumor types are represented. The concordance among Pearson’s value means was defined as a degree of agreement among the correlation sign. Partial concordance: dotted interaction lines. Total concordance: solid interaction lines. The network was obtained from Cytoscape 3.8.2 (https://cytoscape.org/). (B) STRING network analysis (https://string-db.org/) of selected proteins significantly correlated with each other (Pearson’s r ≥ 0.3 or ≤ −0.3; p ≤ 0.05). Edge thickness indicates the strength of data support. (C) Gene ontology analysis according to STRING algorithms. Strength of functional enrichments and count of proteins in each KEGG pathway are indicated.
FIGURE 7
FIGURE 7
OS and PFI analyses according to LCN2, SCL22A17, and MMP9 gene expression. Volcano plot visualization of tumor types in which LCN2, SCL22A17, and MMP9 gene expression affected the patient’s overall survival (A) and progression free interval (B). The genes showing significant log-rank test (p ≤ 0.05) are represented in red (unfavorable) or in blue (favorable) according to their prognostic significance in each tumor type.
FIGURE 8
FIGURE 8
DNA methylation profiling of LCN2, SLC22A17, and MMP9 in all tumor samples. (A–C) For each CG methylation probeset, the mean of methylation beta value is displayed for all tumor types (empty circles). (D) Heatmap showing the tumors in which the mean GC probeset beta value resulted lower (red) or upper (blue) outliers.
FIGURE 9
FIGURE 9
Correlation analysis between LCN2 (A), SLC22A17 (B), and MMP9 (C) gene/isoforms expression and CG probesets methylation levels in all tumors. Correlation with Pearson’s r ≥ 0.3 or ≤ −0.3 and p ≤ 0.05 were included in the heatmap. Black bold labels indicate the LCN2, SLC22A17, and MMP9 genes (ENSG). Coding ENST isoforms: blue; non-coding ENST isoforms: green; retained intron ENST isoforms: red.
FIGURE 10
FIGURE 10
Correlation analysis between LCN2 gene/isoforms expression and relative CG probesets methylation levels in each tumor type. (A) Volcano plot showing the correlation between CG probesets and gene/isoforms expression of LCN2 (Pearson’s r ≥ 0.3 and ≤ −0.3, p ≤ 0.01). The top ten hits (five positive and five negative) based on correlation significance are labeled. Blue dots: negative correlation, red dots: positive correlation. (B) Percentage of tumor types, gene/isoforms and CG probesets showing Pearson’s r ≥ 0.3 and ≤ −0.3 (p ≤ 0.01), separately. No more than ten variables with the highest correlation values are indicated.
FIGURE 11
FIGURE 11
Correlation analysis between SLC22A17 gene/isoforms expression and relative CG probesets methylation levels in each tumor type. (A) Volcano plot showing the correlation between CG probesets and gene/isoforms expression of SLC22A17 (Pearson’s r ≥ 0.3 and ≤ −0.3, p ≤ 0.01). The top ten hits (five positive and five negative) based on correlation significance are labeled. Blue dots: negative correlation, red dots: positive correlation. (B) Percentage of tumor types, gene/isoforms and CG probesets showing Pearson’s r ≥ 0.3 and ≤ −0.3 (p ≤ 0.01), separately. No more than ten variables with the highest correlation values are indicated.
FIGURE 12
FIGURE 12
Correlation analysis between MMP9 isoforms expression and relative CG probesets methylation levels in each tumor type. (A) Volcano plot showing the correlation between CG probesets and isoforms expression of MMP9 (Pearson’s r ≥ 0.3 and ≤ −0.3, p ≤ 0.01). The top ten hits (five positive and five negative) based on correlation significance are labeled. Blue dots: negative correlation, red dots: positive correlation. (B) Percentage of tumor types, gene/isoforms and CG probesets showing Pearson’s r ≥ 0.3 and ≤ −0.3 (p ≤ 0.01), separately. No more than ten variables with the highest correlation values are indicated.
FIGURE 13
FIGURE 13
Synergic effect of promoter hypomethylation and body hypermethylation in the upregulation of SLC22A17. (A) Correlation analysis between gene expression (ENSG00000092096.14) and CG probesets methylation levels of SLC22A17 was evaluated for each tumor type. Only CG probesets showing Pearson’s r ≥ 0.3 (magenta circles) and r ≤ −0.3 (green circles) p (≤0.05) are included. Magenta dots indicate the cg16420801 probeset while green dots represent the cg23464698 probeset. Green label indicates tumor types in which both CG probesets are significantly correlated. (B) Differential analysis (two-tailed unpaired t-test) of SLC22A17 (ENSG00000092096.14) expression was performed stratifying the tumor samples in different four groups based on the methylation levels of cg16420801 and cg23464698 probesets with respect to the mean value calculated for each CG probeset in all tumor samples. FC and pValue are reported for each comparing group.
FIGURE 14
FIGURE 14
OS analysis according to methylation levels of CG probesets relative to LCN2, SLC22A17, and MMP9 in all tumor types. The CG probesets statistically associated (p ≤ 0.05) with OS are represented in the heatmap.
FIGURE 15
FIGURE 15
PFI analysis according to methylation levels of CG probesets relative to LCN2, SLC22A17, and MMP9 in all tumor types. The CG probesets statistically associated (p ≤ 0.05) with PFI are represented in the heatmap.

Similar articles

Cited by

References

    1. Abba M., Patil N., Allgayer H. (2014). MicroRNAs in the regulation of MMPs and metastasis. Cancers (Basel) 6, 625–645. 10.3390/cancers6020625 - DOI - PMC - PubMed
    1. Abdelsameea E., Nada A., Omar N., Saleh S. M., Naguib M., El-Ezawy H. E. M., et al. (2020). Urine neutrophil gelatinase-associated lipocalin a possible diagnostic marker for Egyptian hepatocellular carcinoma patients. Asian pac. J. Cancer Prev. 21, 2259–2264. 10.31557/APJCP.2020.21.8.2259 - DOI - PMC - PubMed
    1. Annaházi A., Ábrahám S., Farkas K., Rosztóczy A., Inczefi O., Földesi I., et al. (2016). A pilot study on faecal MMP-9: A new noninvasive diagnostic marker of colorectal cancer. Br. J. Cancer 114, 787–792. 10.1038/bjc.2016.31 - DOI - PMC - PubMed
    1. Barillari G. (2020). The impact of matrix metalloproteinase-9 on the sequential steps of the metastatic process. Int. J. Mol. Sci. 21, 4526. 10.3390/ijms21124526 - DOI - PMC - PubMed
    1. Barresi V., Vitarelli E., Reggiani Bonetti L., Tuccari G., Barresi G. (2012). Diagnostic value of neutrophil gelatinase-associated lipocalin (NGAL) immunoexpression in follicular-patterned lesions of the thyroid gland. Virchows Arch. 460, 319–325. 10.1007/s00428-012-1208-0 - DOI - PubMed