One-Step RT-qPCR for Viral RNA Detection Using Digital Analysis
- PMID: 35340840
- PMCID: PMC8948435
- DOI: 10.3389/fbioe.2022.837838
One-Step RT-qPCR for Viral RNA Detection Using Digital Analysis
Abstract
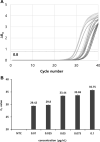
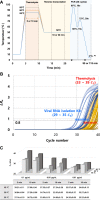
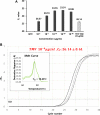
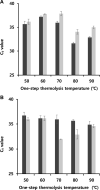
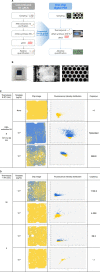
The rapid detection of viruses is becoming increasingly important to prevent widespread infections. However, virus detection via reverse transcription-quantitative polymerase chain reaction (RT-qPCR) is time-consuming, as it involves independent nucleic acid extraction and complementary DNA synthesis. This process limits the potential for rapid diagnosis and mass analysis, which are necessary to curtail viral spread. In this study, a simple and rapid thermolysis method was developed to circumvent the need for extraction and purification of viral RNA. The developed protocol was applied to one-chip digital PCR (OCdPCR), which allowed thermolysis, RT, and digital PCR in a single unit comprising 20,000 chambers of sub-nanoliter volume. Two viruses such as tobacco mosaic virus and cucumber mosaic virus were tested as model viral particles. First, the temperature, exposure time, and template concentration were optimized against tobacco mosaic viral particles, and the most efficient conditions were identified as 85°C, 5 min, and 0.01 μg/nL with a cycle threshold of approximately 33. Finally, the OCdPCR analysis yielded 1,130.2 copies/µL using 10-2 μg/nL of viral particles in a 30 min thermolysis-RT reaction at 70°C. This novel protocol shows promise as a quick, accurate, and precise method for large-scale viral analysis in the future.
Keywords: RT-qPCR; multiplex detection; one-chip digital PCR; thermolysis; virus detection.
Copyright © 2022 Park, Jung, Jang, Namkoong and Choi.
Conflict of interest statement
WJ, HJ, and KN were employed by Samsung Electronics Co.Ltd. The remaining authors declare that the research was conducted in the absence of any commercial or financial relationships that could be construed as a potential conflict of interest.
Figures

Similar articles
-
Development and validation of a multiplex reverse transcription quantitative PCR (RT-qPCR) assay for the rapid detection of Citrus tristeza virus, Citrus psorosis virus, and Citrus leaf blotch virus.J Virol Methods. 2015 Aug;220:64-75. doi: 10.1016/j.jviromet.2015.04.013. Epub 2015 Apr 20. J Virol Methods. 2015. PMID: 25907469
-
Development of a multiplex RT-PCR assay for the detection of soybean mosaic virus, bean common mosaic virus and cucumber mosaic virus in field samples of soybean.J Virol Methods. 2021 Dec;298:114278. doi: 10.1016/j.jviromet.2021.114278. Epub 2021 Sep 7. J Virol Methods. 2021. PMID: 34499966
-
Highly Selective Multiplex Quantitative Polymerase Chain Reaction with a Nanomaterial Composite Hydrogel for Precise Diagnosis of Viral Infection.ACS Appl Mater Interfaces. 2021 Jul 7;13(26):30295-30305. doi: 10.1021/acsami.1c03434. Epub 2021 Jun 24. ACS Appl Mater Interfaces. 2021. PMID: 34165969
-
Duplex RT-qPCR for the detection of hepatitis E virus in water, using a process control.Int J Food Microbiol. 2012 Jul 2;157(2):167-73. doi: 10.1016/j.ijfoodmicro.2012.05.001. Epub 2012 May 9. Int J Food Microbiol. 2012. PMID: 22633799
-
Field detection of multiple RNA viruses/viroids in apple using a CRISPR/Cas12a-based visual assay.Plant Biotechnol J. 2021 Feb;19(2):394-405. doi: 10.1111/pbi.13474. Epub 2020 Sep 17. Plant Biotechnol J. 2021. PMID: 32886837 Free PMC article.
Cited by
-
Editorial: Rapid detection of fungi, microbial, and viral pathogens based on emerging biosensing technology.Front Bioeng Biotechnol. 2022 Nov 17;10:1067322. doi: 10.3389/fbioe.2022.1067322. eCollection 2022. Front Bioeng Biotechnol. 2022. PMID: 36466334 Free PMC article. No abstract available.
References
LinkOut - more resources
Full Text Sources

