. 2021 Dec;9(12):e002772.
doi: 10.1136/jitc-2021-002772.

Sensitizing tumors to anti-PD-1 therapy by promoting NK and CD8+ T cells via pharmacological activation of FOXO3

Affiliations

Sensitizing tumors to anti-PD-1 therapy by promoting NK and CD8+ T cells via pharmacological activation of FOXO3

Young Min Chung et al. J Immunother Cancer. 2021 Dec.

Abstract

Background: Stimulating antitumor immunity by blocking programmed death-1 (PD-1) or its ligand (programmed death-ligand 1 (PD-L1) is a promising antitumor therapy. However, numerous patients respond poorly to PD-1/PD-L1 blockade. Unresponsiveness to immune-checkpoint blockade (ICB) can cast significant challenges to the therapeutic options for patients with hard-to-treat tumors. There is an unmet clinical need to establish new therapeutic approaches for mitigating ICB unresponsiveness in patients. In this study, we investigated the efficacy and role of low-dose antineoplastic agent SN-38 or metformin in sensitizing unresponsive tumors to respond to ICB therapy.

Methods: We assessed the significant pathological relationships between PD-L1 and FOXO3 expression and between PD-L1 and c-Myc or STAT3 expression in patients with various tumors. We determined the efficacy of low-dose SN-38 or metformin in sensitizing unresponsive tumors to respond to anti-PD-1 therapy in a syngeneic tumor system. We deciphered novel therapeutic mechanisms underlying the SN-38 and anti-PD-1 therapy-mediated engagement of natural killer (NK) or CD8+ T cells to infiltrate tumors and boost antitumor immunity.

Results: We showed that PD-L1 protein level was inversely associated with FOXO3 protein level in patients with ovarian, breast, and hepatocellular tumors. Low-dose SN-38 or metformin abrogated PD-L1 protein expression, promoted FOXO3 protein level, and significantly increased the animal survival rate in syngeneic mouse tumor models. SN-38 or metformin sensitized unresponsive tumors responding to anti-PD-1 therapy by engaging NK or CD8+ T cells to infiltrate the tumor microenvironment (TME) and secret interferon-γ and granzyme B to kill tumors. SN-38 suppressed the levels of c-Myc and STAT3 proteins, which controlled PD-L1 expression. FOXO3 was essential for SN38-mediated PD-L1 suppression. The expression of PD-L1 was compellingly linked to that of c-Myc or STAT3 in patients with the indicated tumors.

Conclusion: We show that SN-38 or metformin can boost antitumor immunity in the TME by inhibiting c-Myc and STAT3 through FOXO3 activation. These results may provide novel insight into ameliorating patient response to overarching immunotherapy for tumors.

Keywords: CD8-positive T-lymphocytes; combined modality therapy; immunomodulation; immunotherapy; natural killer T-cells.


Conflict of interest statement

Competing interests: None declared.

Figures
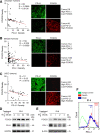
Figure 1
Figure 1
A significant inverse relationship between PD-L1 and FOXO3 protein expression is discovered in patients with various tumors, and PD-L1 and FOXO3 protein expression in mouse tumor cells are regulated by low-dose SN-38. (A–C) Using immunofluorescence (IF) analysis, we determined the protein expression of PD-L1 and FOXO3 in three different human primary tumor tissues that were tumor tissue microarrays (TMAs) of OvCa, invasive BCa, and HCC specimens. Each tumor TMA slide was incubated with an anti-FOXO3 or ant-PD-L1 antibody (Ab) and followed by an Alexa Fluor 594-conjugated or 488-conjugated secondary Ab and IF analysis was performed using fluorescence confocal microscopy. (D and E) Mouse ID-8 OvCa cells were treated with a dose–response (D) or a time course (E) of SN-38 or DMSO control (0 nM) as indicated. Protein expression in total lysates of treated cells were analyzed by immunoblotting (IB) with anti-PD-L1 and anti-FOXO3 Abs as indicated. GAPDH and β-Actin represent loading controls. (F) ID-8 cells were treated with low-dose SN-38 (10 nM) or DMSO control and analyzed by flow cytometry with indicated Abs or isotype control IgG. BCa, breast cancer; DMSO, dimethylsulfoxide; HCC, hepatocellular carcinoma; OvCa, ovarian cancer; PD-L1, programmed death-ligand 1.
Figure 2
Figure 2
Low-dose SN-38 significantly increases the animal survival rate, regulates PD-L1 and FOXO3 expression in mouse ID-8 tumor tissues, and engages mouse CD49b/NK1.1/NKp46-positive NK cells infiltrating the ID-8 TME in a syngeneic mouse ID8 tumor model. Mouse ID-8 cells (2×10⁵ cells/injection) were injected into the peritoneal cavity of female C57BL6 mice (n=9/group). (A) The scheme of the therapeutic model is shown. Twenty days after the inoculation of ID-8 cells, the mice were given an intraperitoneal (i.p.) injection (0.1 mL) of SN-38 (20 µg/kg body weight (BW)/mouse) or metformin (20 mg/kg BW/mouse) or an equal amount of DMSO (control) three times per week at even intervals for several weeks (up to 18 weeks). (B) Animal survival rates of the different groups were shown as Kaplan-Meier survival curves, which were calculated by the Kaplan-Meier method. The median survival days were shown. The significance was compared using the log-rank test. P values between the SN-38 group versus the DMSO group and between the metformin group versus the DMSO group were 0.0093 and 0.0328, respectively. (C) Three slides of tumor samples from mice treated with DMSO or SN-38 were incubated with anti-PD-L1 or anti-FOXO3 Abs and followed by Alexa Fluor 488-conjugated or 594-conjugated secondary Abs and IF analysis as described previously. Four archetypal IF images were displayed; all IF images and DAPI (the nuclear staining) images were shown in online supplemental figure S1). (D and E) The relative expression of PD-L1 and FOXO3 between tumors treated with DMSO and SN-38 in vivo are shown in the histograms as indicated, respectively. Scale bar: 20 µm. (F and G) Three slides of samples from ID8 tumors treated with DMSO or SN-38 were incubated with antimouse CD49b Ab (F) or NK1.1 Ab (G) and followed by fluorescent secondary Abs and IF analysis. The IF images and DAPI images were shown in online supplemental figure S2. (H and I) Total lysates of tumor samples were analyzed by immunoblotting with the indicated anti-NKp46 and anti-NKp44 Abs. (J) Similarly, tumor samples were incubated with antimouse IFN-γ Ab and secondary Ab. GAPDH represents loading controls. Abs, antibodies; DMSO, dimethylsulfoxide; IF, immunofluorescence; IFN-γ, interferon-γ; NK, natural killer; PD-L1, programmed death-ligand 1; TME, tumor microenvironment.
Figure 3
Figure 3
SN-38 or metformin significantly suppresses tumor growth in vivo monitored by bioluminescent imaging. (A) Timeline (weekly) of bioluminescent signals in a representative showed growing mouse tumor injected with 5.0×10⁶ ID8-luc2 cells. (B) In the DMSO control group, he bioluminescence level increased significantly at weeks 4 and 5 (*p<0.05, **p<0.005). All scales in photons/second/cm2/steradian. (C) This figure shows flow cytometry analysis of tumor cells treated with controls or two different drugs (DMSO, metformin, or SN-38). Gray color: isotype control; blue color: DMSO-treated tumor cells; green color: metformin-treated tumor cells; and orange color: SN-38-treated tumor cells. The right panel shows elevated FOXO3 expression on each drug-treated tumor cells (n=3, *p<0.05, **p<0.005). (D) Gray color: isotype control; blue color: DMSO-treated tumor cells; green color: metformin-treated tumor cells; and orange color: SN-38-treated tumor cells. The right panel shows decreased PD-L1 expression on each drug-treated tumor cells (n=3, *p<0.05, **p<0.005). (E) This figure shows flow cytometry analysis of CD3 or NKp46 expressing immune cells isolated from mouse tumors. CD3 (T cell marker) or NKp46 (NK cell marker) shows each changed population in the drug-treated tumor. Metformin or SN-38 treated tumor tissues show increased CD3 positive cells or NKp46 positive cells. The right panel shows a significantly increased CD3 or NKp46 positive population in tumor tissues (n=3, *p<0.05, **p<0.005). (F) This figure shows flow cytometry analysis of CD8 or NKp46 expressing immune cells isolated from mouse tumors. CD8 (cytotoxic T cell marker) or NKp46 (NK cell marker) shows each changed population in the drug-treated tumor. Metformin or SN-38 treated tumor tissues show increased CD8 positive cells or NKp46 positive cells. The right panel shows a significantly increased CD8 (cytotoxic T cells) positive population in tumor tissues (n=3, *p<0.05). DMSO, dimethylsulfoxide; NK, natural killer; PD-L1, programmed death-ligand 1.
Figure 4
Figure 4
SN-38 sensitizes unresponsive tumors to respond to anti-PD-1 mAb therapy, regulates PD-L1 and FOXO3 expression in tumors, and engages mouse NK1.1/CD49b-positive NK cells and/or some CD3/CD8-positive T cells to infiltrate the TME in a syngeneic mouse tumor model. (A) Mouse ID8 cells were injected into female C57BL6 mice subcutaneously (n=4/group). When palpable solid ID8 tumors were detected, mice were given an intraperitoneal injection (0.1 mL) of an anti-PD-1 Ab (8 mg/kg BW/mouse) or SN-38 (100 µg/kg BW/mouse) or a combination of both drugs (PD-1 Ab + SN38) or equal amounts of controls, mouse isotype IgG or DMSO, once per week at even intervals for 5 weeks. (B) The ID8 tumor tissues were excised from the treated mice for IF analysis. Three slides of samples from ID8 tumors treated with the indicated regimens or controls were incubated with antimouse PD-L1 or antimouse FOXO3 Abs and followed by Alexa Fluor 488-conjugated or 594-conjugated secondary Abs and IF analysis as described previously. Archetypal IF images were illustrated; all IF and DAPI images were shown in online supplemental figure S3. Scale bar: 50 µm. (c) The relative expression of PD-L1 and FOXO3 between tumors treated with the indicated regimens or controls in vivo are shown in the histograms, respectively. (D) Three slides of samples from ID8 tumors treated with the indicated regimens or controls were incubated with antimouse NK1.1 or antimouse CD3 Abs and followed by secondary Abs and IF analysis. Paradigmatic IF images were shown; all IF and DAPI images were displayed in online supplemental figure S4. Scale bar: 20 µm. (E) The relative expression of mouse NK1.1 and CD3 among tumors treated with the indicated regimens or controls in vivo are shown in the histograms as indicated, respectively. (F–I) Similarly, three slides of samples from these tumors were incubated with antimouse Abs against CD49b or CD3 or CD8, and IF analysis was performed as described previously. Scale bar: 20 µm. The relative expression of mouse CD49b and CD3 (G) or CD8 (I) among tumors treated with the indicated regimens in vivo are shown in the histograms as indicated, respectively. Paradigmatic IF images were shown; all IF and DAPI images were displayed in online supplemental figure S5 and S6. Scale bar: 20 µm. Abs, antibodies; BW, body weight; DMSO, dimethylsulfoxide; IF, immunofluorescence; mAb, monoclonal antibody; PD-L1, programmed death-ligand 1; TME, tumor microenvironment.
Figure 5
Figure 5
Differentially expressed gene sets (GO category) and selected genes analyzed by RNA SEQ related to the immune response in agents (DMSO + IgG or SN-38 + PD-1 Ab) treated tumor tissues. (A) Top 10 biological functional annotated increased or decreased gene expression were performed in DAVID (web-based tool). Each bar presents the number of genes in signature categories. (B) The composition of immune cell types was predicted by the EPIC web-based tool. The SN-38 + PD-1 Ab treated tumor samples predicted more T cells and NK cells in the tumor tissues. (C) This panel shows T cell or NK cell markers’ differential expression, transcripts per million (TPM). The tumor samples treated with SN-38 plus PD-1 Ab showed increased T cell and NK cell markers expression. (D) The representative color heat maps based on Z-score significantly increased genes related to T cell or NK cell activation (D: DMSO + IgG treatment, S: SN-38 + PD-1 Ab treatment). Ab, antibody; DAVID, Database for Annotation, Visualization, and Integrated Discovery; DMSO, dimethylsulfoxide; EPIC, Estimating the Proportions of Immune and Cancer; GO, Gene Ontology; IFN-γ, interferon-γ; NK, natural killer; PD-1, programmed death-1.
Figure 6
Figure 6
NK cells mediate the killing of tumor cells in vivo by inducing IFN-γ and granzyme B secretion in the ID8 TME and in vitro cell-based systems in an indicated regimen-dependent manner. (A and B) Three slides of samples from ID8 tumors treated with the indicated regimens or controls were incubated with antimouse NK1.1 or antimouse IFN-γ (A) or antimouse granzyme B (B) and followed by secondary Abs and IF analysis as described previously. The relative expression of mouse NK1.1 and IFN-γ (A) or granzyme B (B) among these tumors with treatment regimens are shown in the histograms as indicated, respectively. All IF and DAPI images were displayed in online supplemental figures S7 and S8. Scale bar: 20 µm. (C) Three slides of samples from these ID8 tumors were subjected to TUNEL assays (Promega) for determining cellular apoptosis. Archetypal TUNEL images were shown; all TUNEL images were displayed in online supplemental figure S9. Scale bar: 20 µm. (D) Three slides of samples from these ID8 tumors were subjected to cleaved-PARP1 IF analysis for determining cellular apoptosis. All cleaved-PARP1 IF images were displayed in online supplemental figure S10. Scale bar: 20 µm. (E) Mouse metastatic tumor 4T1-Luc cells (40,000 cells/well) were treated with NK-92 (10,000 cells/well) in the presence of low-dose SN-38 or other pharmacological drugs as indicated or DMSO (control) for 36 hours. After removing NK cells, the survival rates of tumor cells were measured by cell counting. *P<0.022. (F) Similarly, 4T1-Luc tumor cells (20,000 cells/well) were treated with NK-92 (10,000 cells/well) in the presence of higher doses of pharmacological drugs than those used in figure part E. **P<0.0006. Abs, antibodies; DMSO, dimethylsulfoxide; IF, immunofluorescence; IFN-γ, interferon-γ; NK, natural killer; TME, tumor microenvironment.
Figure 7
Figure 7
FOXO3 is essential and sufficient for SN38-mediated suppression of PD-L1 expression, and SN-38 or combined regimens significantly suppress STAT3-pY705, IL-6, and c-Myc expression in syngeneic ID8 tumors. (A) Mouse ID-8 cells were transfected with specific siRNA targeting mouse FOXO3 or control siRNA and treated with low-dose SN-38 or DMSO (control). Protein expression in total lysates of these cells were detected by immunoblotting (IB) with the indicated Abs, and GAPDH represents loading controls. (B) The OVCA429-Control-shRNA and -FOXO3-shRNA stable cell lines (as described in Materials and methods) were treated with low-dose SN-38 (10 nM) or DMSO control. Using IB analysis, protein expression in total lysates of these cells were detected with the indicated Abs. GAPDH represents loading controls. (C) OVCA429-Control-shRNA and -FOXO3-shRNA cell lines were treated with low-dose SN-38 (10 nM) or DMSO control. Three slides of samples from these cells treated with SN-38 were incubated with an anti-PD-L1 (MAB1561) and anti-FOXO3 (FKHRL1, sc-9813) and followed by fluorescent secondary Abs and IF analysis as described previously. (D) The histogram shows the integrated density of PD-L1 protein-expressing cells (n=100). (E) Mouse ID-8 cells were transfected with FOXO3 cDNA expression vector or control vector (pcDNA3). Using IB analysis, protein expression in total lysates of these cells were determined with the indicated Abs. β-Actin represents loading controls. (F and G) Three slides of samples from ID8 tumors treated with the indicated regimens or controls were incubated with antimouse STAT3-pY705 (F) or antimouse IL-6 (g) and followed by secondary Abs and IF analysis as described previously. The relative protein levels of STAT3-pY705 (F) and IL-6 (G) in the TME treated with different regimens in vivo are shown in the histograms as indicated. All IF and DAPI images were displayed in online supplemental figure S11. (H) Three slides of samples from ID8 tumors treated with the indicated regimens were incubated with an antimouse c-Myc or anti-mouse PD-L1 Ab and followed by secondary Abs and IF analysis. The relative expression of c-Myc and PD-L1 in the TME are shown in the histograms. All IF and DAPI images were displayed in online supplemental figure S12. (I) Using IB analysis, protein expression in total lysates of samples from OVCA429 tumors treated with DMSO or low-dose SN-38 (5 µg/kg BW/mouse) in vivo were assessed with the indicated Abs. GAPDH represents loading controls. (J) ID-8 cells were transfected with specific siRNA targeting mouse c-Myc or STAT3, or JAK1 or control siRNA for 48 hours. Using IB analysis, protein expression in total lysates of these cells were detected with the indicated Abs. β-Actin represents loading controls. Abs, antibodies; DMSO, dimethylsulfoxide; IB, immunoblotting; IF, immunofluorescence; PD-L1, PD-L1; TME, tumor microenvironment.
Figure 8
Figure 8
PD-L1 expression is very positively associated with c-Myc or STAT3 expression in patients with various tumors, and a model for the mechanism is proposed. (A–C) Using IF analysis, we determined the protein expression of PD-L1 and c-Myc in TMAs of OvCa (A), invasive BCa (B), and HCC (C) specimens. Each tumor TMA slide was incubated with anti-PD-L1 or anti-c-Myc Abs and followed by specific fluorescent secondary Abs and IF analysis, as described previously. (D–F) We analyzed both PD-L1 versus STAT3 mRNA expression data in human primary ovarian tumor (D), breast tumor (E), and HCC tumor (F) tissues from the Cancer Genome Atlas (TCGA) datasets using cBioPortal. PD-L1 expression was positively associated with STAT3 expression in ovarian ad breast tumors. P values between the PD-L1 group versus the STAT3 group were shown. (G and H) We analyzed PD-L1 versus STAT3 and PD-L1 versus FOXO3 mRNA expression data in human primary pediatric neuroblastoma and stomach cancer tissues from TCGA datasets. P values between the tested groups were shown. (I) We analyzed PD-L1 versus FOXO3 mRNA expression data in various human primary tumor tissues (n=2158) from TCGA datasets. P values between the tested groups were shown. (J) A schema depicts a proposed model for the FOXO3-mediated blocking dual c-Myc-PDL1 and STAT3-PD-L1 pathways by SN-38 to promote NK or CD8+ T cell antitumor immunity. Abs, antibodies; BCa, breast cancer; HCC, hepatocellular carcinoma; IF, immunofluorescence; NK, natural killer; OvCa, PD-L1, programmed death-ligand 1; TMA, tissue microarray.

Similar articles

Cited by

References

    1. Topalian SL, Drake CG, Pardoll DM. Immune checkpoint blockade: a common denominator approach to cancer therapy. Cancer Cell 2015;27:450–61. 10.1016/j.ccell.2015.03.001 - DOI - PMC - PubMed
    1. Zou W, Wolchok JD, Chen L. PD-L1 (B7-H1) and PD-1 pathway blockade for cancer therapy: mechanisms, response biomarkers, and combinations. Sci Transl Med 2016;8:328rv4. 10.1126/scitranslmed.aad7118 - DOI - PMC - PubMed
    1. Doo DW, Norian LA, Arend RC. Checkpoint inhibitors in ovarian cancer: a review of preclinical data. Gynecol Oncol Rep 2019;29:48–54. 10.1016/j.gore.2019.06.003 - DOI - PMC - PubMed
    1. O'Reilly EM, Oh D-Y, Dhani N, et al. . Durvalumab with or without tremelimumab for patients with metastatic pancreatic ductal adenocarcinoma: a phase 2 randomized clinical trial. JAMA Oncol 2019;5:1431–8. 10.1001/jamaoncol.2019.1588 - DOI - PMC - PubMed
    1. Brahm CG, van Linde ME, Enting RH, et al. . The current status of immune checkpoint inhibitors in neuro-oncology: a systematic review. Cancers 2020;12:3. 10.3390/cancers12030586 - DOI - PMC - PubMed

Publication types

MeSH terms