. 2021 Feb 19;11(9):4061-4077.
doi: 10.7150/thno.52558. eCollection 2021.

miR-375 prevents high-fat diet-induced insulin resistance and obesity by targeting the aryl hydrocarbon receptor and bacterial tryptophanase (tnaA) gene

Affiliations

miR-375 prevents high-fat diet-induced insulin resistance and obesity by targeting the aryl hydrocarbon receptor and bacterial tryptophanase (tnaA) gene

Anil Kumar et al. Theranostics. .

Abstract

Background: Diet manipulation is the basis for prevention of obesity and diabetes. The molecular mechanisms that mediate the diet-based prevention of insulin resistance are not well understood. Here, as proof-of-concept, ginger-derived nanoparticles (GDNP) were used for studying molecular mechanisms underlying GDNP mediated prevention of high-fat diet induced insulin resistance. Methods: Ginger-derived nanoparticles (GDNP) were isolated from ginger roots and administered orally to C57BL/6 high-fat diet mice. Fecal exosomes released from intestinal epithelial cells (IECs) of PBS or GDNP treated high-fat diet (HFD) fed mice were isolated by differential centrifugation. A micro-RNA (miRNA) polymerase chain reaction (PCR) array was used to profile the exosomal miRs and miRs of interest were further analyzed by quantitative real time (RT) PCR. miR-375 or antisense-miR375 was packed into nanoparticles made from the lipids extracted from GDNP. Nanoparticles was fluorescent labeled for monitoring their in vivo trafficking route after oral administration. The effect of these nanoparticles on glucose and insulin response of mice was determined by glucose and insulin tolerance tests. Results: We report that HFD feeding increased the expression of AhR and inhibited the expression of miR-375 and VAMP7. Treatment with orally administered ginger-derived nanoparticles (GDNP) resulted in reversing HFD mediated inhibition of the expression of miR-375 and VAMP7. miR-375 knockout mice exhibited impaired glucose homeostasis and insulin resistance. Induction of intracellular miR-375 led to inhibition of the expression of AhR and VAMP7 mediated exporting of miR-375 into intestinal epithelial exosomes where they were taken up by gut bacteria and inhibited the production of the AhR ligand indole. Intestinal exosomes can also traffic to the liver and be taken up by hepatocytes, leading to miR-375 mediated inhibition of hepatic AhR over-expression and inducing the expression of genes associated with the hepatic insulin response. Altogether, GDNP prevents high-fat diet-induced insulin resistance by miR-375 mediated inhibition of the aryl hydrocarbon receptor mediated pathways over activated by HFD feeding. Conclusion: Collectively our findings reveal that oral administration of GDNP to HFD mice improves host glucose tolerance and insulin response via regulating AhR expression by GDNP induced miR-375 and VAMP7.

Keywords: AhR; E. coli tryptophanase (tnaA); Exosomes; Ginger derived nanoparticles; VAMP7; gut/liver axis; indole; insulin resistance.; miR-375.


Conflict of interest statement

Competing Interests: The authors have declared that no competing interest exists.

Figures

Figure 1
Figure 1
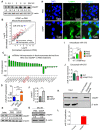
miR-375 regulates AhR expression. (A) Bar graph showing the fold-change in the expression of microRNAs in HFD mice small intestinal tissue induced by GDNP treatment, (expression following treatment with PBS served as the baseline value). The bar graph shows only microRNAs with >5 fold up- or downregulation. (B) Alteration of gene expression of small intestine (SI) tissues from high-fat diet (HFD)-fed mice treated with either PBS or GDNP (using an Affymetrix array). Red boxes highlighted are the genes involved in insulin signaling and lipid metabolism. (C) qPCR assay for miR-375 in cells cultured with PBS or GDNP for 12 h. (D) Graphical representation of the miR-375 binding site in AhR mRNA as predicted by TargetScan. (E) qPCR quantification of AhR expression in small intestine tissues of HFD-fed mice treated with PBS or GDNP. (F) Western blot presenting AhR expression in the small intestine tissues of lean and HFD-fed mice treated with PBS or GDNP. (G & H) AhR mRNA by qPCR (G) and protein expression by western blot (H) in MC-38 cells treated with PBS or GDNP with anti-sense-miR375 or scramble. Ratio to β-actin were shown (numbers in the middle of each panel). (I & J) AhR mRNA (I) and protein expression (J) in the small intestine tissues of RCD mice orally administered nanoparticles (Nano-scramble or Nano-miR375). Ratio to β-actin is shown in the middle as numbers. One-way ANOVA with the Bonferroni correction for multiple comparisons and the Student t test (one tailed) were used to calculate statistical significance (p value *<0.05; **<0.01; ***<0.001; ****<0.0001).
Figure 2
Figure 2
GDNP induces miR-375 in MC-38 cells and sorts into exosomes. (A) qRT-PCR for intracellular and exosomal miR-375 levels and AhR expression in MC-38 cells cultured with various concentrations of GDNP for 12 h. (B) qRT-PCR comparison for intracellular vs exosomal levels of miR-375 in MC-38 cells cultured with various concentrations of GDNP. (C) miR-375 levels expression in MC-38 cells cultured with GDNP in a time dependent manner. (D) miR-375 levels expression in FL83B (hepatocyte) cells cultured with GDNP in a dose dependent manner. One-way ANOVA with the Bonferroni correction for multiple comparisons and the Student t test (one tailed) were used to calculate statistical significance (p value *<0.05; **<0.01; ***<0.001).
Figure 3
Figure 3
miR-375 is sorted into exosomes via VAMP7 and intracellular miR-375 regulates AhR expression. (A) Western blots for VAMP7 protein levels in MC-38 cells cultured with various concentrations of GDNP. Ratio of VAMP7 to β-actin is shown as a number between the two gels. (B) miRNA array expression profile of intestinal epithelial cell exosomes (A33+CD63+ exosomes) from feces derived from HFD-fed mice treated with GDNP vs PBS. (C) Bar graph showing HFD-fed mouse fecal exosomal miRNAs with a fold change (>25-fold or <5-fold) following treatment with GDNP vs PBS. (D) qRT PCR analysis of miR-375 expression in intestinal epithelial cell exosomes (A33+CD63+) from lean and HFD-fed mice treated with GDNP vs PBS. (E) Western blot showing VAMP7 expression in the small intestine of lean and HFD-fed mice treated with PBS or GDNP. Ratio of VAMP7 to β-actin is shown as a number between the two panels. (F & G) qRT-PCR analysis (F) and western blot (G) of VAMP7 expression in PBS- or GDNP-treated MC-38 cells. (H) Confocal images displaying VAMP7 expression in PBS- or GDNP-treated MC-38 cells. (I) qPCR analysis of the intracellular expression of miR-375 in WT and VAMP7KO MC-38 cells. (J) qPCR analysis of the exosomal levels of miR-375 in WT and VAMP7KO MC-38 cells. (K) MC-38 cells were transfected with biotinylated miR-375 and pulled-down with streptavidin beads. Western blots were carried out for VAMP7 using eluted extract from streptavidin beads. (L) qPCR for miR-375 in pulled-down product used for cDNA preparation. One-way ANOVA with the Bonferroni correction for multiple comparisons and the Student t (two-tailed) test were used to calculate statistical significance (p value *<0.05; **<0.01; ***<0.001).
Figure 4
Figure 4
Gut epithelial cell exosomes (CD63+A33+) influence gut bacterial populations and modulate microbial metabolites. (A) Representative electron micrograph of gut bacteria containing fecal exosomes. Yellow arrows indicate exosomes inside and outside the bacteria. (B) FACS analysis of PKH26-positive gut bacteria from mice orally administered PKH-26-labeled fecal exosomes. (C) Confocal images of bacteria showing uptake of PKH-26-labeled fecal exosomes (red). (D) Schematic diagram of the putative targeting site of mmu-miR-375-3p in the E. coli tryptophanase (tnaA). (E) mRNA levels of the tnaA gene in gut bacteria derived from HFD mice treated with PBS or GDNP. (F) 2D LC-MS/MS analysis of unmetabolized tryptophan levels excreted into the feces of PBS- or GDNP-treated HFD-fed mice. (G) Quantification of the indole levels in the feces (h) and plasma (i) obtained from lean and HFD-fed mice that were treated with PBS or GDNP. (H) Fold change in tnaA gene expression in fecal bacteria (left), and indole estimation in the fecal supernatants (middle) and plasma (right) from GDNP-treated HFD-fed mice treated with PBS or nanoparticles packaged with antisense-miR375 or scramble. One-way ANOVA with the Tukey correction for multiple comparisons and the Student t (one tailed) test were used to calculate statistical significance (p value *<0.05; **<0.01; ***<0.001; ****<0.0001).
Figure 5
Figure 5
Human fecal exosomal miR-375 is negatively correlated with indole production. (A) qPCR analysis of miR-375 levels in human fecal exosomes and plasma exosomes derived from healthy, obese and individuals with T2D. (B) Quantification of indole levels in the feces and plasma. (C) Quantification of plasma cholesterol and triglyceride levels. (D) Scatter plot depicting the linear correlation between cholesterol and miR-375 levels, and triglycerides and miR-375 levels. (E) Principle component analysis (PCoA) of miR-375 and indole levels in obese, T2D and healthy human fecal exosomes. One-way ANOVA with the Bonferroni correction for multiple comparisons was used to calculate statistical significance. (p value *<0.05; **<0.01; ***<0.001).
Figure 6
Figure 6
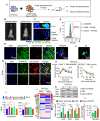
miR-375 improves insulin sensitivity and glucose homeostasis and prevents dyslipidemia. (A) Graphical representation of the experiment, which consisted of adoptive transfer of CD63+A33+ fecal exosomes (HFD-Exo) from HFD mouse (HFD fed 12 months) plus nanoparticles containing miR-375. Nanoparticles generated using the total lipid from GDNP. (B) Live imaging of mice orally administered PKH26 labeled nanoparticles containing miR-375. (C) Imaging of the liver, small and large intestines indicating the presence of labeled nanoparticles 6 hours after oral administration. (D) PKH26 labeled nanoparticle uptake by hepatocytes (albumin-positive cells) or Kupffer (F4/80-positive) cells. (E) Representative images of cellular uptake of PKH26-labeled nanoparticles by hepatocytes (albumin-positive cells). PKH26-labeled particles are indicated by pink arrows. (F) 3D image of PKH26-labeled nanoparticles in hepatocytes. (G) Confocal imaging to detect AhR (FITC) and biotinylated miR-375 or scrambled microRNA in liver tissues derived from mice orally administered nanoparticles. (H) GTT and ITT for C57BL/6 mice that received the fecal exosomes (HFD-Exo) along with nanoparticles containing miR-375 or scrambled RNA for 14 days while the mice were fed a HFD. Statistical comparisons were made between HFD-Exo vs Nano-miR375; HFD-Exo was responsible for insulin resistance and miR-375 responsible for preventing the development of insulin resistance. Nanoparticles contained scramble RNA (Nano-scramble); nanoparticles only (Nano); and nanoparticles contained miR-375 (Nano-miR375). (I) Cholesterol and triglyceride levels in plasma derived from HFD mice treated with either PBS or nanoparticles (above mentioned) for 14 days. (J) Insulin signaling array of mouse hepatocytes cultured with fecal exosomes (HFD-Exo) along with nanoparticles (contained scramble & nano-miR-375) showing alterations in genes involved in insulin signaling. Green-boxed genes promote insulin activity and red-boxed genes inhibit insulin activity. (K) Western blot depicting Foxa2, AhR, and IRS-1 and 2 expression in hepatocytes treated with fecal exosomes (HFD-Exo) along with nanoparticles (contained scramble & nano-miR-375). The ratio to β-actin is shown in bar graph form as part of panel K. (L) Effect of fecal exosomes (HFD-Exo) on glucose uptake by hepatocytes. One-way ANOVA with a Bonferroni correction for multiple comparisons test was used to calculate statistical significance. (p value *<0.05; **<0.01; ***<0.001; ****<0.0001).

Comment in

Similar articles

Cited by

References

    1. Hruby A, Hu FB. The Epidemiology of Obesity: A Big Picture. Pharmacoeconomics. 2015;33:673–89. - PMC - PubMed
    1. Rothhammer V, Quintana FJ. The aryl hydrocarbon receptor: an environmental sensor integrating immune responses in health and disease. Nature reviews Immunology. 2019;19:184–97. - PubMed
    1. Kerley-Hamilton JS, Trask HW, Ridley CJ, Dufour E, Ringelberg CS, Nurinova N. et al. Obesity is mediated by differential aryl hydrocarbon receptor signaling in mice fed a Western diet. Environ Health Perspect. 2012;120:1252–9. - PMC - PubMed
    1. Roh E, Kwak SH, Jung HS, Cho YM, Pak YK, Park KS. et al. Serum aryl hydrocarbon receptor ligand activity is associated with insulin resistance and resulting type 2 diabetes. Acta Diabetol. 2015;52:489–95. - PubMed
    1. Latreille M, Herrmanns K, Renwick N, Tuschl T, Malecki MT, McCarthy MI. et al. miR-375 gene dosage in pancreatic beta-cells: implications for regulation of beta-cell mass and biomarker development. J Mol Med (Berl) 2015;93:1159–69. - PMC - PubMed

Publication types

MeSH terms