. 2021 Apr;592(7852):80-85.
doi: 10.1038/s41586-021-03345-1. Epub 2021 Mar 10.

Inherent mosaicism and extensive mutation of human placentas

Affiliations

Inherent mosaicism and extensive mutation of human placentas

Tim H H Coorens et al. Nature. 2021 Apr.

Erratum in

Abstract

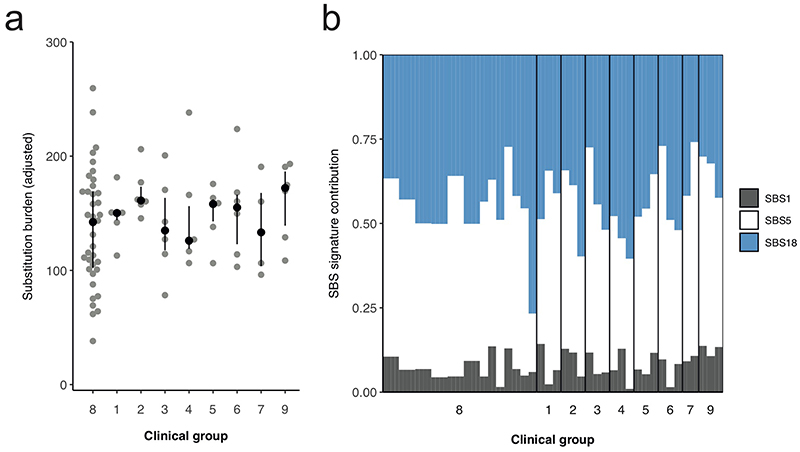
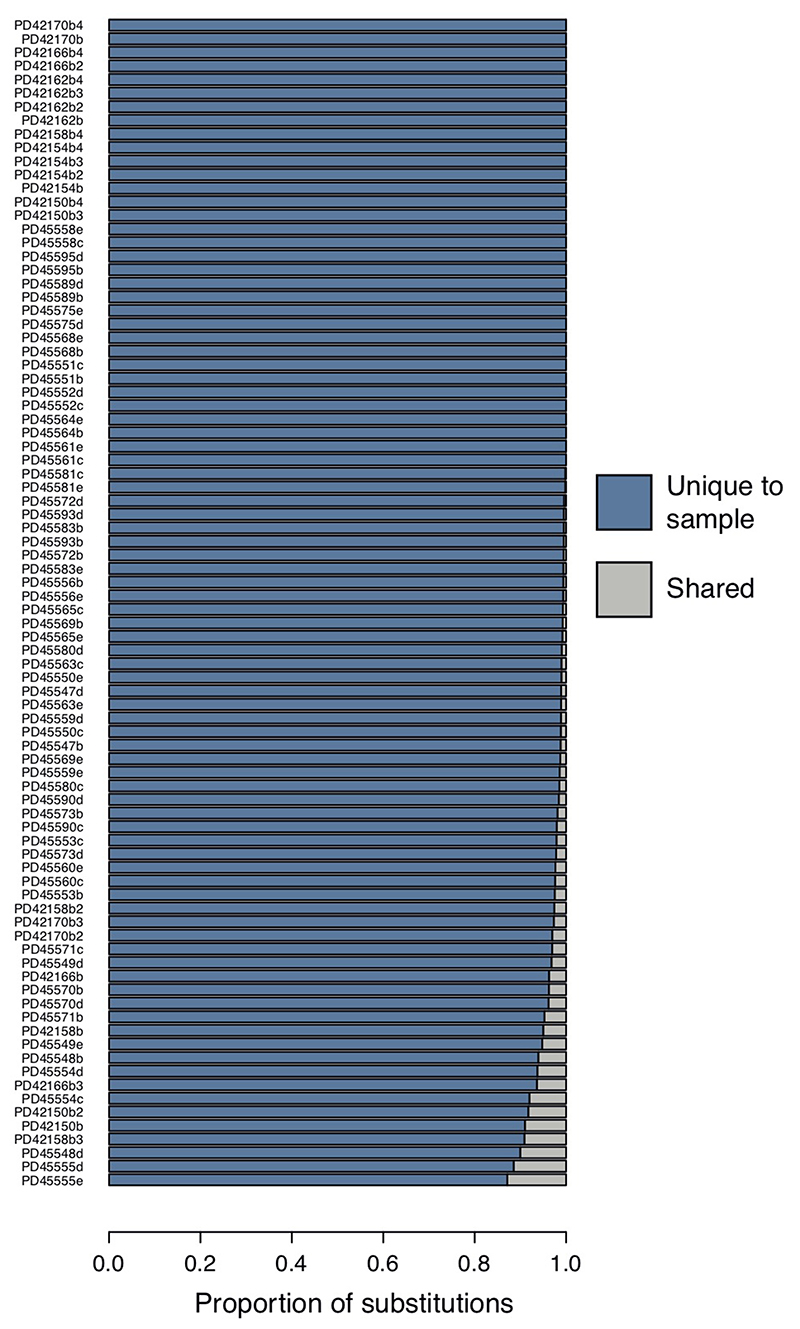
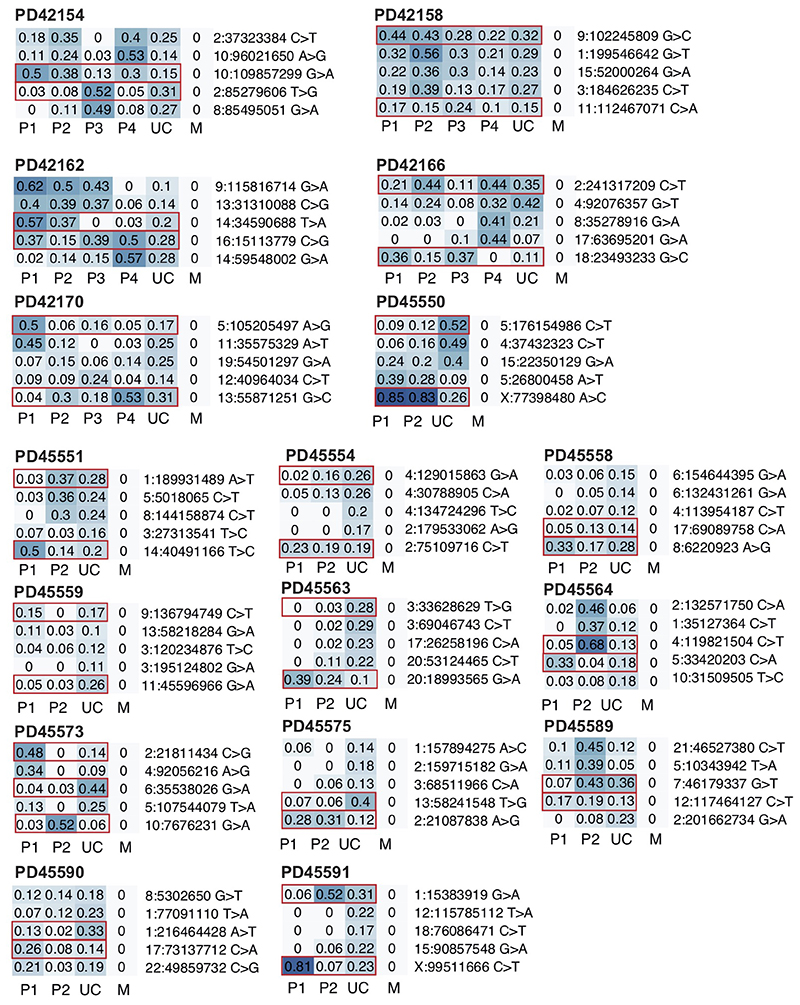
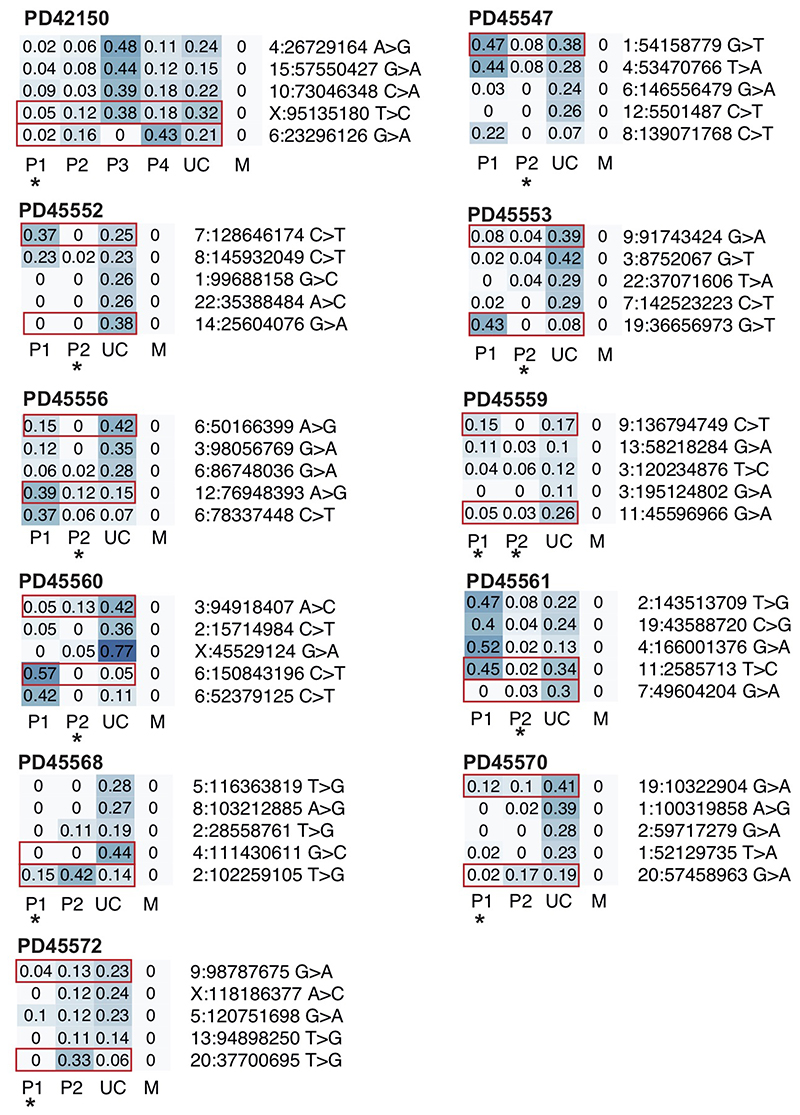
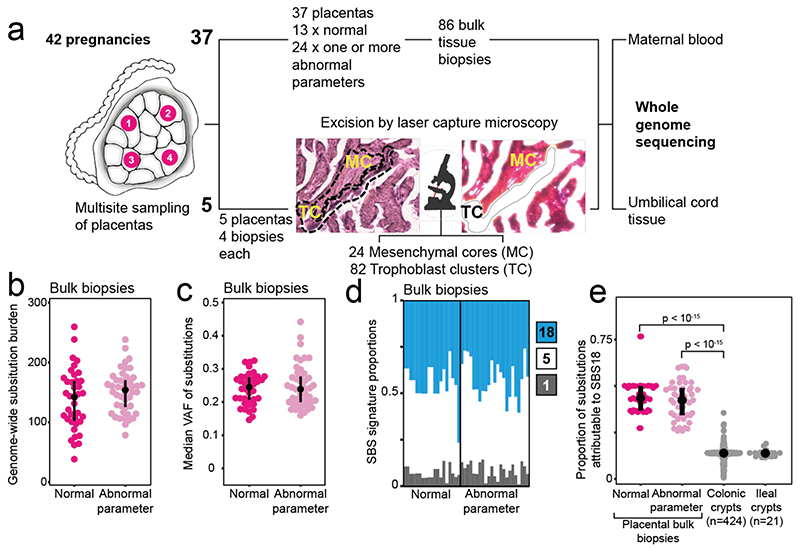
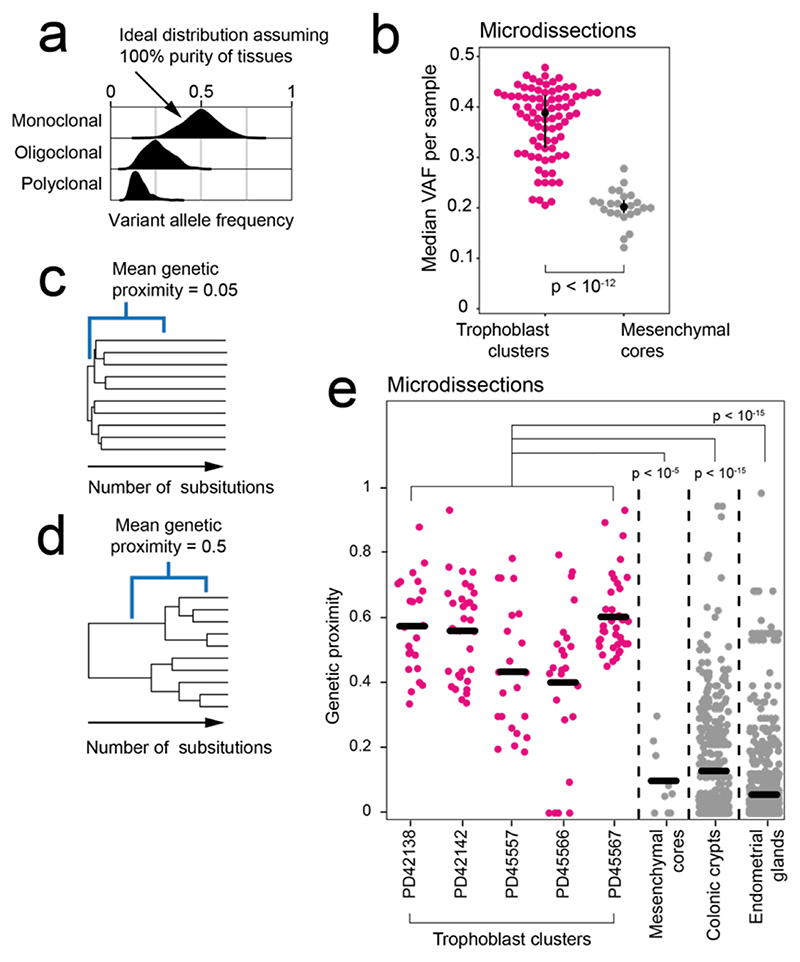
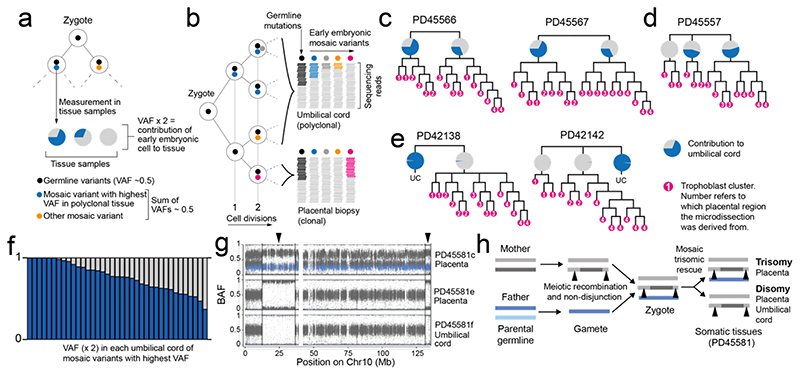
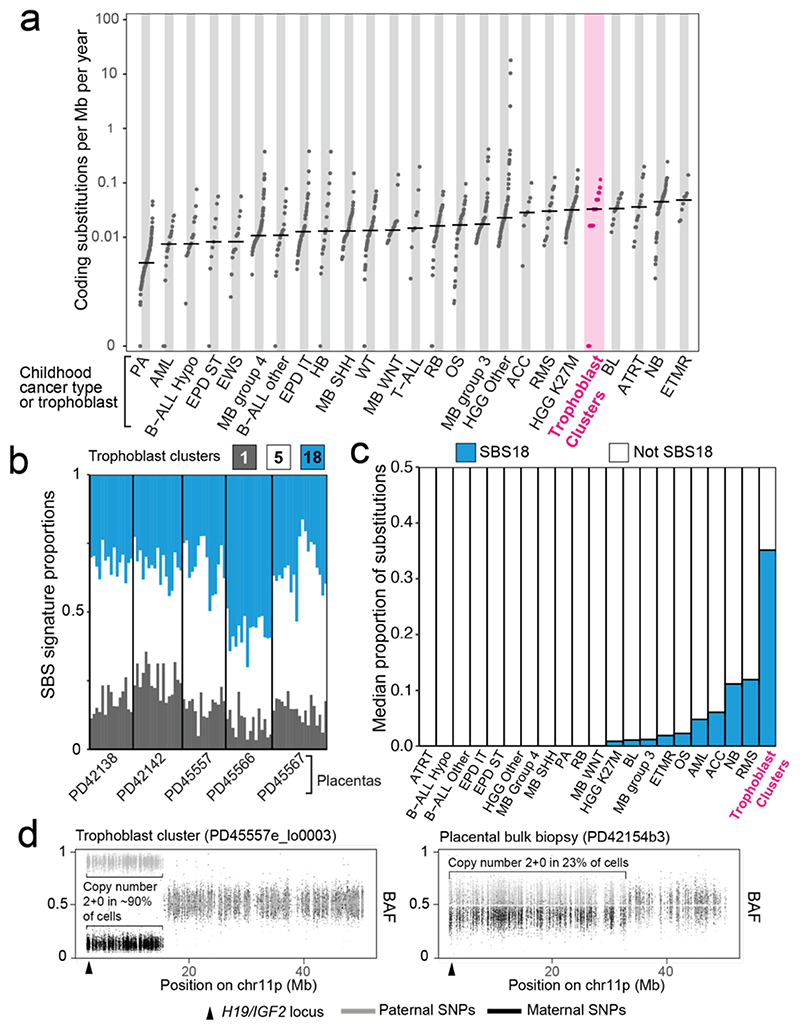
Placentas can exhibit chromosomal aberrations that are absent from the fetus1. The basis of this genetic segregation, which is known as confined placental mosaicism, remains unknown. Here we investigated the phylogeny of human placental cells as reconstructed from somatic mutations, using whole-genome sequencing of 86 bulk placental samples (with a median weight of 28 mg) and of 106 microdissections of placental tissue. We found that every bulk placental sample represents a clonal expansion that is genetically distinct, and exhibits a genomic landscape akin to that of childhood cancer in terms of mutation burden and mutational imprints. To our knowledge, unlike any other healthy human tissue studied so far, the placental genomes often contained changes in copy number. We reconstructed phylogenetic relationships between tissues from the same pregnancy, which revealed that developmental bottlenecks genetically isolate placental tissues by separating trophectodermal lineages from lineages derived from the inner cell mass. Notably, there were some cases with full segregation-within a few cell divisions of the zygote-of placental lineages and lineages derived from the inner cell mass. Such early embryonic bottlenecks may enable the normalization of zygotic aneuploidy. We observed direct evidence for this in a case of mosaic trisomic rescue. Our findings reveal extensive mutagenesis in placental tissues and suggest that mosaicism is a typical feature of placental development.


Conflict of interest statement

Competing Interests

No competing interests are declared by the authors of this study.

Figures

Extended Data Figure 1
Extended Data Figure 1. Differences in substitutions between clinical groups
Analysis per clinical group of the absolute substitution burden of each bulk placental sample (a) and their associated mutational signatures (b). The difference in substitution burden between the clinical groups is not significant (Kruskal-Wallis rank sum test, p=0.7438). Each point and bar represent a single bulk placental sample. Clinical groups are defined in Extended Data Tables 2-3.
Extended Data Figure 2
Extended Data Figure 2. Unique variants in placental biopsies
Proportion of variants that are unique to each bulk placental sample (blue), so absent from matched umbilical cord as well as any other bulk placental sample taken from the same case.
Extended Data Figure 3
Extended Data Figure 3. Asymmetry across trophectoderm and umbilical cord
Heatmaps of VAFs of early embryonic mutations with the two earliest lineages contributing both to placenta and umbilical cord. Putative earliest mutations highlighted in red. P, placenta; UC, umbilical cord; M, maternal.
Extended Data Figure 4
Extended Data Figure 4. Unexplained placental lineages
Heatmaps of VAFs of early embryonic mutations with the two earliest lineages contributing umbilical cord. Putative earliest mutations highlighted in red. Asterisk indicates placental lineage is not fully explained by umbilical cord (see Methods). P, placenta; UC, umbilical cord; M, maternal.
Extended Data Figure 5
Extended Data Figure 5. Full segregation of placental and umbilical cord lineages
Heatmaps of VAFs of early embryonic mutations with the umbilical cord being derived from one clonal lineage. In all cases, one or more placental lineages do not share any genetic ancestry with umbilical cord and are largely unexplained, as indicated by an asterisk (see Methods). P, placenta; UC, umbilical cord; M, maternal.
Extended Data Figure 6
Extended Data Figure 6. Substitution burden per individual trophoblast cluster
Adjusted for coverage and median variant allele frequency.
Extended Data Figure 7
Extended Data Figure 7. Indels versus substitutions
Indel burden versus substitution burden per trophoblast cluster. Both are corrected for median VAF and coverage.
Extended Data Figure 8
Extended Data Figure 8. Impacts of mutations
Overview of functional consequences of unique SNVs (a) and indels (b) seen in the placental biopsies and trophoblast clusters.
Extended Data Figure 9
Extended Data Figure 9. Sensitivity of variant calling
(a) Histogram of the estimated sensitivity for SNV calling in microdissected trophoblast clusters and bulk placenta samples. (b) The observed sensitivity of germline variants across placental samples plotted against the coverage of the sample. The red dashed line indicates our predicted sensitivity, which we would have used as sensitivity correction.
Extended Data Figure 10
Extended Data Figure 10. Signatures extraction and deconvolution
Signature extraction by HDP yielded a noise component (a) and one genuine mutational signature (b), which could be convoluted and reconstructed using three reference mutational signatures: SBS1, SBS5 and SBS18 (c).
Figure 1
Figure 1. The genomes of bulk placental biopsies.
(a) Workflow detailing experimental design with a photomicrograph demonstrating microdissection of placental tissue. (b) Substitution burden per bulk placental sample, adjusted for coverage and median VAF (Methods). An abnormal pregnancy is defined by the deviation of one or more clinically validated markers from their normal range over the course of pregnancy (Supplementary Tables 2-3). (c) Median VAF of substitutions in each bulk placental sample. (d) SBS signatures in placental biopsies. Each column represents one bulk sample. Colours represent signatures, as per legend. (e) Prevalence of SBS18 mutations in bulk placental biopsies in comparison to human intestinal tissue, the normal tissue with the highest prevalence of SBS18 reported to date. P-values refer to the two-sided Wilcoxon rank sum test.
Figure 2
Figure 2. Clonal architecture of microdissected trophoblast clusters and mesenchymal cores.
(a) Theoretical, expected VAF distribution as per different clonal architecture, assuming 100% purity. (b) Comparison of the median substitution VAF between microdissected trophoblast (n=82) and mesenchymal cores (n=24). P-value refers to the two-sided Wilcoxon rank sum test. (c, d) Genetic proximity scores (Methods) were calculated as the fraction of shared mutations between two samples divided by their mean total mutation burden. For example, a mean score of 0.05 conveys little sharing (c), while 0.5 signifies a longer shared development (d). (e). Genetic proximities across trophoblast clusters, mesenchymal cores, colonic crypts (n=326) and endometrial glands (n=252) from single biopsies. Each dot represents the comparison of two of the same histological unit (e.g., two trophoblast clusters) from the same bulk sample. P-values refer to the two-sided Wilcoxon rank sum test.
Figure 3
Figure 3. Early embryonic genetic bottlenecks and their relationship to trisomic rescue.
(a) Schematic depicting the detection of the earliest post-zygotic mutations and the estimation of contribution to samples from their VAFs. (b) Hypothetical lineage tree of early embryo showing how measurements of VAF relate to cell divisions. (c) The contribution of the major lineage to the umbilical cord as calculated from the embryonic mutation with the highest VAF. (d) Early trees of trophoblast clusters of PD45566 and PD45567, with the contribution of lineages to the umbilical cord coloured in blue in pie charts. The umbilical cord exhibits an asymmetric contribution of the daughter cells of the zygote. (e) Early cellular contribution in PD45557 shows separation of one placental lineage. (f) In PD42138 and PD42142 the placental and umbilical cord lineages do not share any early embryonic mutations. (g) B-allele frequency (BAF) of germline SNPs on chromosome 10 in PD45581, showing a trisomy in PD45581c (placenta), but a disomy in PD45581e (placenta) and PD45581f (umbilical cord). SNPs absent from mother are coloured in blue. (h) Overview of genomic events in PD45581 and parents leading to the observed mosaic trisomic rescue. The arrowheads highlight areas of two genotypes in PD45581c due to meiotic recombination in the mother.
Figure 4
Figure 4. The genomes of microdissected trophoblast clusters.
(a) Comparison of the coding substitutions per Mb per year between trophoblast microdissections and paediatric malignancies. Per year estimates are corrected for gestation. Abbreviations: Pilocytic astrocytoma (PA), acute myeloid leukaemia (AML), hypodiploid B-cell acute lymphoblastic leukaemia (B-ALL Hypo), supratentorial ependymoma (EPD ST), Ewing’s sarcoma (EWS), medulloblastoma group 4 (MB group 4), non-diploid B-cell acute lymphoblastic leukaemia (B-ALL other), infratentorial ependymoma (EPD IT), hepatoblastoma (HB), medulloblastoma SHH subgroup (MB SHH), Wilms tumour (WT), medulloblastoma WNT subgroup (MB WNT), T-cell acute lymphoblastic leukaemia (T-ALL), retinoblastoma (RB), osteosarcoma (OS), medulloblastoma group 3 (MB group 3), high-grade glioma K27wt (HGG Other), adrenocortical carcinoma (ACC), rhabdomyosarcoma (RMS), high-grade glioma K27M (HGG K27M), Burkitt’s lymphoma (BL), atypical teratoid rhabdoid tumour (ATRT), neuroblastoma (NB), embryonal tumours with multilayered rosettes (ETMR). (b) Single base substitution signatures in trophoblast clusters. Each column represents one piece of microdissected tissue. (c) Bar chart showing the median proportion of substitutions attributable to SBS18. Abbreviations as per (a). (d) Partial paternal uniparental disomy of 11p in two samples, represented by the BAF of SNPs across 11p. Grey denotes SNPs contributed by the father and black by the mother.

Similar articles

Cited by

References

    1. Kalousek DK, Dill FJ. Chromosomal mosaicism confined to the placenta in human conceptions. Science. 1983;221:665–667. doi: 10.1126/science.6867735. - DOI - PubMed
    1. Brosens I, Pijnenborg R, Vercruysse L, Romero R. The “Great Obstetrical Syndromes” are associated with disorders of deep placentation. Am J Obstet Gynecol. 2011;204:193–201. doi: 10.1016/j.ajog.2010.08.009. - DOI - PMC - PubMed
    1. Kalousek DK, et al. Confirmation of CVS mosaicism in term placentae and high frequency of intrauterine growth retardation association with confined placental mosaicism. Prenat Diagn. 1991;11:743–750. doi: 10.1002/pd.1970111002. - DOI - PubMed
    1. Xenopoulos P, Kang M, Hadjantonakis AK. In: Mouse Development Results and Problems in Cell Differentiation. Kubiak J, editor. Springer; 2012. Cell Lineage Allocation Within the Inner Cell Mass of the Mouse Blastocyst. - PMC - PubMed
    1. Bolton H, et al. Mouse model of chromosome mosaicism reveals lineage-specific depletion of aneuploid cells and normal developmental potential. Nat Commun. 2016;7:11165. doi: 10.1038/ncomms11165. - DOI - PMC - PubMed

Publication types