Impacts on product quality attributes of monoclonal antibodies produced in CHO cell bioreactor cultures during intentional mycoplasma contamination events
- PMID: 32436993
- PMCID: PMC7496122
- DOI: 10.1002/bit.27436
Impacts on product quality attributes of monoclonal antibodies produced in CHO cell bioreactor cultures during intentional mycoplasma contamination events
Abstract
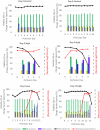
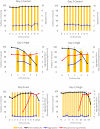
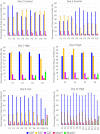
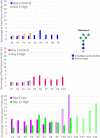
A mycoplasma contamination event in a biomanufacturing facility can result in costly cleanups and potential drug shortages. Mycoplasma may survive in mammalian cell cultures with only subtle changes to the culture and penetrate the standard 0.2-µm filters used in the clarification of harvested cell culture fluid. Previously, we reported a study regarding the ability of Mycoplasma arginini to persist in a single-use, perfusion rocking bioreactor system containing a Chinese hamster ovary (CHO) DG44 cell line expressing a model monoclonal immunoglobulin G 1 (IgG1) antibody. Our previous work showed that M. arginini affects CHO cell growth profile, viability, nutrient consumption, oxygen use, and waste production at varying timepoints after M. arginini introduction to the culture. Careful evaluation of certain identified process parameters over time may be used to indicate mycoplasma contamination in CHO cell cultures in a bioreactor before detection from a traditional method. In this report, we studied the changes in the IgG1 product quality produced by CHO cells considered to be induced by the M. arginini contamination events. We observed changes in critical quality attributes correlated with the duration of contamination, including increased acidic charge variants and high mannose species, which were further modeled using principal component analysis to explore the relationships among M. arginini contamination, CHO cell growth and metabolites, and IgG1 product quality attributes. Finally, partial least square models using NIR spectral data were used to establish predictions of high levels (≥104 colony-forming unit [CFU/ml]) of M. arginini contamination, but prediction of levels below 104 CFU/ml were not reliable. Contamination of CHO cells with M. arginini resulted in significant reduction of antibody product quality, highlighting the importance of rapid microbiological testing and mycoplasma testing during particularly long upstream bioprocesses to ensure product safety and quality.
Keywords: Chinese hamster ovary (CHO) cell culture; biomanufacturing; bioprocessing; critical quality attribute (CQA); monoclonal antibody (mAb); mycoplasma; partial least squares (PLS) regression; principal component analysis (PCA).
© 2020 The Authors. Biotechnology and Bioengineering published by Wiley Periodicals LLC.
Conflict of interest statement
The authors declare that there are no conflict of interests.
Figures


Similar articles
-
Impacts of intentional mycoplasma contamination on CHO cell bioreactor cultures.Biotechnol Bioeng. 2019 Dec;116(12):3242-3252. doi: 10.1002/bit.27161. Epub 2019 Sep 11. Biotechnol Bioeng. 2019. PMID: 31478189 Free PMC article.
-
Bioprocess: Robustness with Respect to Mycoplasma Species.PDA J Pharm Sci Technol. 2020 Mar-Apr;74(2):201-212. doi: 10.5731/pdajpst.2018.009613. Epub 2019 Sep 13. PDA J Pharm Sci Technol. 2020. PMID: 31519782
-
Establishment of a novel cell line, CHO-MK, derived from Chinese hamster ovary tissues for biologics manufacturing.J Biosci Bioeng. 2024 Jun;137(6):471-479. doi: 10.1016/j.jbiosc.2024.02.005. Epub 2024 Mar 12. J Biosci Bioeng. 2024. PMID: 38472071
-
A Different Perspective: How Much Innovation Is Really Needed for Monoclonal Antibody Production Using Mammalian Cell Technology?Adv Biochem Eng Biotechnol. 2018;165:443-462. doi: 10.1007/10_2018_59. Adv Biochem Eng Biotechnol. 2018. PMID: 29721583 Review.
-
Perfusion culture of Chinese Hamster Ovary cells for bioprocessing applications.Crit Rev Biotechnol. 2022 Nov;42(7):1099-1115. doi: 10.1080/07388551.2021.1998821. Epub 2021 Nov 29. Crit Rev Biotechnol. 2022. PMID: 34844499 Review.
References
-
- Angart, P. , Kohnhorst, C. , Chiang, M. ‐J. , & Arden, N. S. (2018). Considerations for risk and control of mycoplasma in bioprocessing. Current Opinion in Chemical Engineering, 22(Biotechnology and bioprocess engineering), 161–166.
-
- Chandler, D. K. F. , Volokhov, D. V. , & Chizhikov, V. E. (2011). Historical overview of mycoplasma testing for production of biologics. American Pharmaceutical Review, 14, 37370.
Publication types
MeSH terms
Substances
Grants and funding
LinkOut - more resources
Full Text Sources
Miscellaneous

