Validation of Risk Prediction Models to Detect Asymptomatic Carotid Stenosis
- PMID: 32310014
- PMCID: PMC7428515
- DOI: 10.1161/JAHA.119.014766
Validation of Risk Prediction Models to Detect Asymptomatic Carotid Stenosis
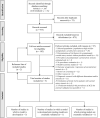
Abstract
Background Significant asymptomatic carotid stenosis (ACS) is associated with higher risk of strokes. While the prevalence of moderate and severe ACS is low in the general population, prediction models may allow identification of individuals at increased risk, thereby enabling targeted screening. We identified established prediction models for ACS and externally validated them in a large screening population. Methods and Results Prediction models for prevalent cases with ≥50% ACS were identified in a systematic review (975 studies reviewed and 6 prediction models identified [3 for moderate and 3 for severe ACS]) and then validated using data from 596 469 individuals who attended commercial vascular screening clinics in the United States and United Kingdom. We assessed discrimination and calibration. In the validation cohort, 11 178 (1.87%) participants had ≥50% ACS and 2033 (0.34%) had ≥70% ACS. The best model included age, sex, smoking, hypertension, hypercholesterolemia, diabetes mellitus, vascular and cerebrovascular disease, measured blood pressure, and blood lipids. The area under the receiver operating characteristic curve for this model was 0.75 (95% CI, 0.74-0.75) for ≥50% ACS and 0.78 (95% CI, 0.77-0.79) for ≥70% ACS. The prevalence of ≥50% ACS in the highest decile of risk was 6.51%, and 1.42% for ≥70% ACS. Targeted screening of the 10% highest risk identified 35% of cases with ≥50% ACS and 42% of cases with ≥70% ACS. Conclusions Individuals at high risk of significant ACS can be selected reliably using a prediction model. The best-performing prediction models identified over one third of all cases by targeted screening of individuals in the highest decile of risk only.
Keywords: atherosclerosis; carotid artery stenosis; external validation; ischemic stroke; prevention; risk prediction model; targeted screening.
Figures


Similar articles
-
Development and Internal Validation of a Risk Score to Detect Asymptomatic Carotid Stenosis.Eur J Vasc Endovasc Surg. 2021 Mar;61(3):365-373. doi: 10.1016/j.ejvs.2020.11.029. Epub 2021 Jan 7. Eur J Vasc Endovasc Surg. 2021. PMID: 33422437 Free PMC article.
-
Detection of asymptomatic carotid stenosis in patients with lower-extremity arterial disease: development and external validations of a risk score.Br J Surg. 2021 Aug 19;108(8):960-967. doi: 10.1093/bjs/znab040. Br J Surg. 2021. PMID: 33876207 Free PMC article.
-
Development of a validated model to predict 30-day stroke and 1-year survival after carotid endarterectomy for asymptomatic stenosis using the Vascular Quality Initiative.J Vasc Surg. 2017 Aug;66(2):433-444.e2. doi: 10.1016/j.jvs.2017.03.427. Epub 2017 Jun 2. J Vasc Surg. 2017. PMID: 28583737
-
Rationale for screening selected patients for asymptomatic carotid artery stenosis.Curr Med Res Opin. 2020 Mar;36(3):361-365. doi: 10.1080/03007995.2020.1713075. Epub 2020 Jan 13. Curr Med Res Opin. 2020. PMID: 31910676 Review.
-
Prediction Models for Clinical Outcome After a Carotid Revascularization Procedure.Stroke. 2018 Aug;49(8):1880-1885. doi: 10.1161/STROKEAHA.117.020486. Stroke. 2018. PMID: 30012816 Free PMC article. Review.
Cited by
-
Prevalence of asymptomatic carotid artery stenosis in Chinese patients with lower extremity peripheral arterial disease: a cross-sectional study on 653 patients.BMJ Open. 2021 Apr 30;11(4):e042926. doi: 10.1136/bmjopen-2020-042926. BMJ Open. 2021. PMID: 33931408 Free PMC article.
-
Prediction of Severe Baseline Asymptomatic Carotid Stenosis and Subsequent Risk of Stroke and Cardiovascular Disease.Stroke. 2024 Nov;55(11):2632-2640. doi: 10.1161/STROKEAHA.123.046894. Epub 2024 Sep 25. Stroke. 2024. PMID: 39319460 Free PMC article.
-
Joint Associations Between Body Mass Index and Waist Circumference With Atrial Fibrillation in Men and Women.J Am Heart Assoc. 2021 Apr 20;10(8):e019025. doi: 10.1161/JAHA.120.019025. Epub 2021 Apr 15. J Am Heart Assoc. 2021. PMID: 33853362 Free PMC article.
-
Development and Internal Validation of a Risk Score to Detect Asymptomatic Carotid Stenosis.Eur J Vasc Endovasc Surg. 2021 Mar;61(3):365-373. doi: 10.1016/j.ejvs.2020.11.029. Epub 2021 Jan 7. Eur J Vasc Endovasc Surg. 2021. PMID: 33422437 Free PMC article.
-
Detection of asymptomatic carotid stenosis in patients with lower-extremity arterial disease: development and external validations of a risk score.Br J Surg. 2021 Aug 19;108(8):960-967. doi: 10.1093/bjs/znab040. Br J Surg. 2021. PMID: 33876207 Free PMC article.
References
-
- Dorresteijn JAN, Visseren FLJ, Wassink AMJ, Gondrie MJA, Steyerberg EW, Ridker PM, Cook NR, van der Graaf Y. Development and validation of a prediction rule for recurrent vascular events based on a cohort study of patients with arterial disease: the SMART risk score. Heart. 2013;99:866–872. - PubMed
-
- Petty GW, Brown RD Jr, Whisnant JP, Sicks JD, O'Fallon WM, Wiebers DO. Ischemic stroke subtypes: a population‐based study of functional outcome, survival, and recurrence. Stroke. 2000;31:1062–1068. - PubMed
-
- Schulz UG, Rothwell PM. Differences in vascular risk factors between etiological subtypes of ischemic stroke: importance of population‐based studies. Stroke. 2003;34:2050–2059. - PubMed
-
- Bogiatzi C, Wannarong T, McLeod AI, Heisel M, Hackam D, Spence JD. SPARKLE (Subtypes of Ischaemic Stroke Classification System), incorporating measurement of carotid plaque burden: a new validated tool for the classification of ischemic stroke subtypes. Neuroepidemiology. 2014;42:243–251. - PubMed
Publication types
MeSH terms
Grants and funding
LinkOut - more resources
Full Text Sources

