. 2019 Oct 11;20(20):5032.
doi: 10.3390/ijms20205032.

Function of miR825 and miR825* as Negative Regulators in Bacillus cereus AR156-elicited Systemic Resistance to Botrytis cinerea in Arabidopsis thaliana

Affiliations

Function of miR825 and miR825* as Negative Regulators in Bacillus cereus AR156-elicited Systemic Resistance to Botrytis cinerea in Arabidopsis thaliana

Pingping Nie et al. Int J Mol Sci. .

Abstract

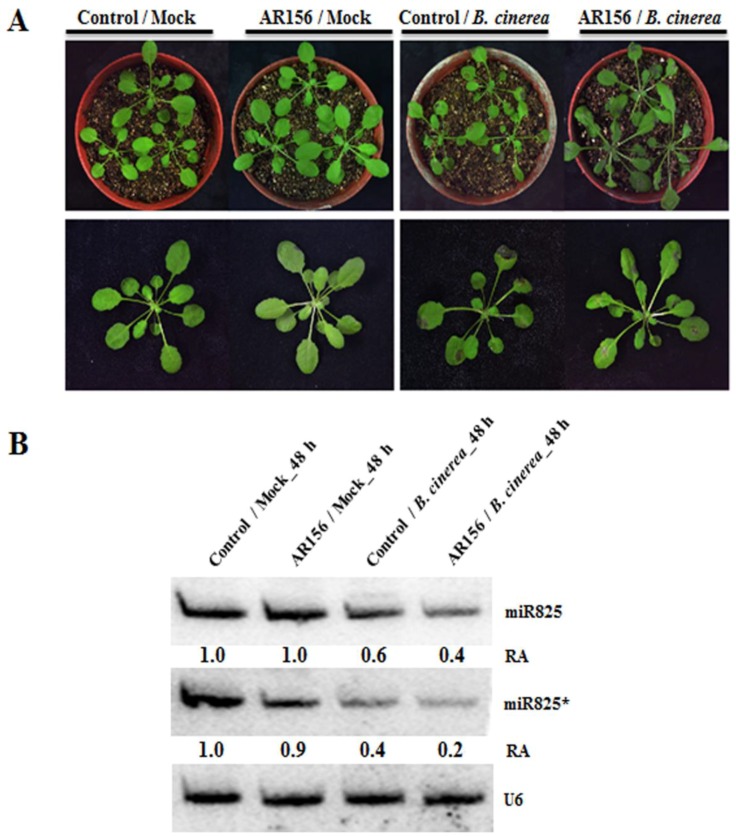
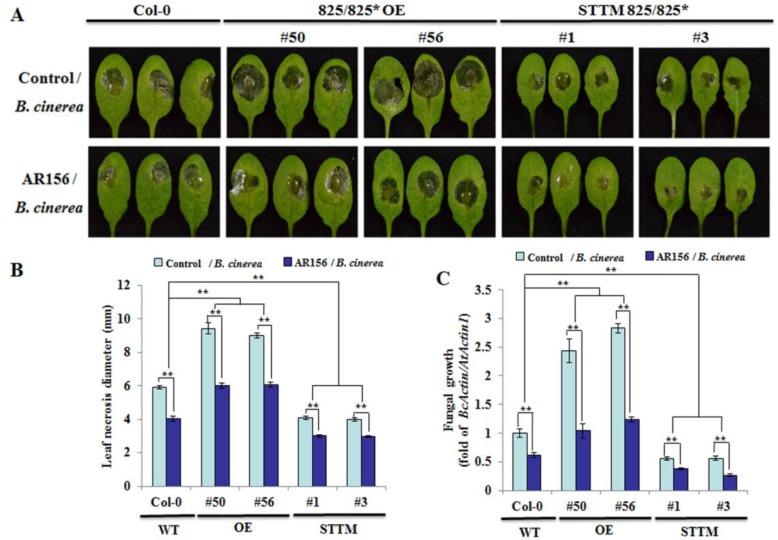
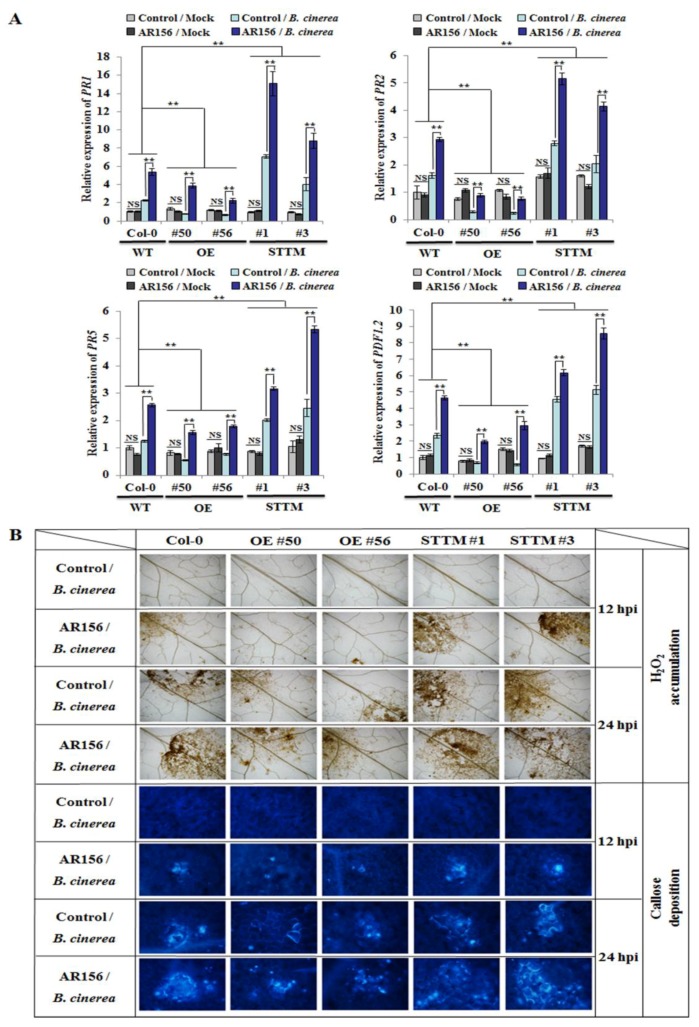
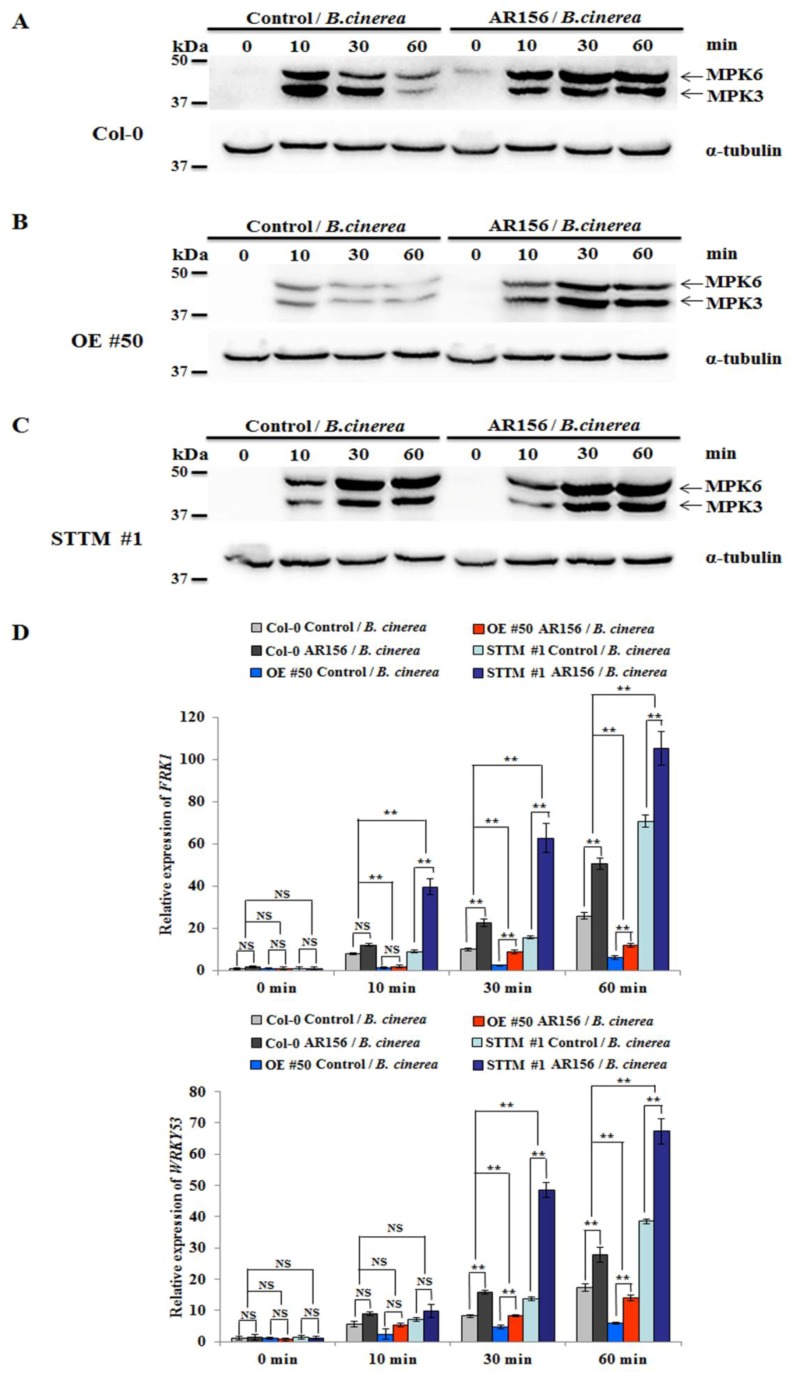
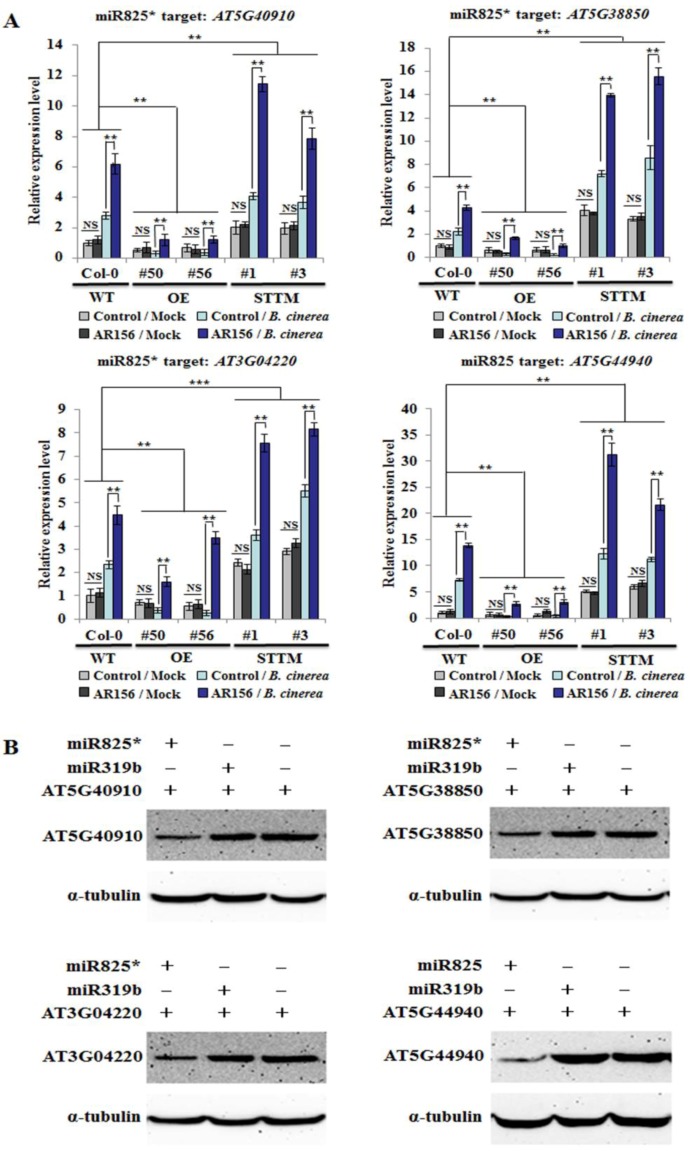
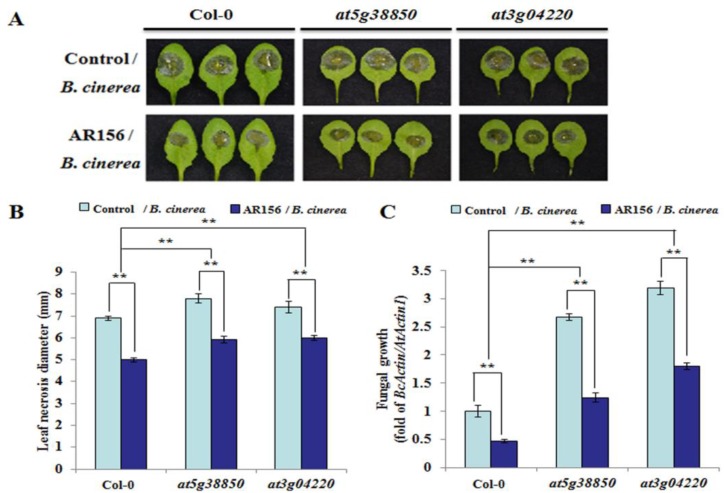
Small RNAs function to regulate plant defense responses to pathogens. We previously showed that miR825 and miR825* downregulate Bacillus cereus AR156 (AR156)-triggered systemic resistance to Pseudomonassyringae pv. tomato DC3000 in Arabidopsis thaliana (Arabidopsis). Here, Northern blotting revealed that miR825 and miR825* were more strongly downregulated in wild type Arabidopsis Col-0 (Col-0) plants pretreated with AR156 than in nontreated plants upon Botrytis cinerea (B. cinerea) B1301 infection. Furthermore, compared with Col-0, transgenic plants with attenuated miR825 and miR825* expression were more resistant to B. cinerea B1301, yet miR825- and miR825*-overexpressing (OE) plants were more susceptible to the pathogen. With AR156 pretreatment, the transcription of four defense-related genes (PR1, PR2, PR5, and PDF1.2) and cellular defense responses (hydrogen peroxide production and callose deposition) were faster and stronger in miR825 and miR825* knockdown lines but weaker in their OE plants than in Col-0 plants upon pathogen attack. Also, AR156 pretreatment caused stronger phosphorylation of MPK3 and MPK6 and expression of FRK1 and WRKY53 genes upon B. cinerea B1301 inoculation in miR825 and miR825* knockdown plants than in Col-0 plants. Additionally, the assay of agrobacterium-mediated transient co-expression in Nicotiana benthamiana confirmed that AT5G40910, AT5G38850, AT3G04220, and AT5G44940 are target genes of miR825 or miR825*. Compared with Col-0, the target mutant lines showed higher susceptibility to B. cinerea B1301, while still expressing AR156-triggered induced systemic resistance (ISR). The two-way analysis of variance (ANOVA) revealed a significant (P < 0.01) interactive effect of treatment and genotype on the defense responses. Hence, miR825 and miR825*act as negative regulators of AR156-mediated systemic resistance to B. cinerea B1301 in Arabidopsis.

Keywords: Bacillus cereus AR156; Botrytis cinerea B1301; induced systemic resistance; miR825 and miR825*; plant innate immunity.


Conflict of interest statement

The authors declare no conflict of interest.

Figures

Figure 1
Figure 1
Theexpression level of miR825 and miR825* in Arabidopsis. Three-week-old Arabidopsis Col-0 plants were pretreated with AR156 at 5 × 10⁸ CFU/mL or 0.85% NaCl (the control) as a root drench; at 7 days post-treatment (dpt), challenge inoculation was carried out by dropping 10 µl of a B. cinerea B1301 spore suspension at 1 × 10⁶ spores/mL or H2O (mock) on the midvein of each side of a leaf. (A) At 48 h post-inoculation (hpi), disease symptoms on leaves were observed and photos were taken. (B) The miR825 and miR825* expression in different treatments was detected by Northern blotting. Total RNA was extracted from leaves of Arabidopsis Col-0 plants in four treatments (control/mock, AR156/mock, control/B. cinerea, and AR156/B. cinerea) at 48 hpi. RNA blots were probed with DNA oligonucleotides complementary to miR825 or miR825*. U6 served as a loading control. Relative abundance (RA) levels are indicated. The experiments were repeated three times, which yielded similar results.
Figure 2
Figure 2
The levels of resistance to B. cinerea B1301 with different genotypes.Three-week-old Arabidopsis plants from Col-0, miR825/825* overexpressing (OE) lines (#50 and #56), and STTM825/825* lines (#1 and #3) were pretreated with AR156 at 5 × 10⁸ CFU/mL or 0.85% NaCl (control) as a root drench; at 7 dpt, all plants were infected with B. cinerea B1301 by dropping 10 μL of its spore suspension (1 × 10⁶ spores/mL) on the midvein of each side of a leaf. (A) Disease symptoms on leaves of each tested plant line at 2 dpi. (B) Necrotic lesions were evaluated at 2 dpi by determining their average diameter on one leaf per plant, with a total of three plants evaluated for each sample. (C) In planta fungal growth in leaves of each tested plant line. The biomass of B. cinerea B1301 was determined by simultaneously quantifying the transcripts of B. cinerea actin gene (BcActin) and the Arabidopsis actin 1gene (AtActin1). Relative fungal biomass was indicated by BcActin/AtActin1, the ratio of BcActin to AtActin1. Two-way analysis of variance (ANOVA) showed significant effects of genotype (P < 0.01) and treatment (P < 0.01), and a significant interactive effect (P < 0.01); ** P < 0.01. The data are presented as mean ± SD from three biological replicates. The experiments wererepeated three times, bringing similar results.
Figure 3
Figure 3
The defense gene expression and cellular defense responses in different genotypes.Roots of three-week-old plants from Col-0, miR825/825* OE lines (#50 and #56), and STTM825/825* lines (#1 and #3) were drenched with AR156 at 5 × 10⁸ CFU/mL or 0.85% NaCl (control). After 7 days, the leaves of these plants were inoculated with a B. cinerea B1301 spore suspension (1 × 10⁶ spores/mL) or H2O (mock), which were collected at 12, 24, and 48 hpi. (A) Transcription of defense-related genes upon attack by B. cinerea B1301. Using qRT-PCR, transcriptional levels of defense genes in leaves collected at 48 hpi were examined and normalized with those of AtActin1. The data are presented as mean ± SD from three biological replicates. The assay was repeated three times, yielding similar results. Two-way ANOVA showed significant effects of genotype on the expression of PR1, PR2, PR5, or PDF1.2 (P < 0.01 for the differences between WT and OE, and also for those between WT and STTM); and a significant treatment effect (P < 0.01) and a significant interactive effect (P < 0.01) on the expression of each tested gene. Note: NS, not significant; ** P < 0.01. (B) Hydrogen peroxide accumulation and callose deposition in situ detected at 12 and 24 hpi in leaves inoculated with B. cinerea B1301. Accumulation of H2O2 was examined by diaminobenzidine (DAB) staining; with aniline blue staining, callose deposition was visible under light and epifluorescence microscopes attached to a UV excitation filter.
Figure 4
Figure 4
The role of miR825 and miR825* in AR156-triggered ISR and PTI. Three-week-old Arabidopsis plants from Col-0, miR825/825* OE line (#50), and STTM825/825* transgenic lines (#1) were pretreated with AR156 at 5 × 10⁸ CFU/mL or 0.85% NaCl (the control) as a root drench. At 7 dpt, they were challenge-inoculated with B. cinerea B1301 as depicted above at 0, 10, 30, and 60 mpi.(AC) Leaves of each tested plant line were collected at 0, 10, 30, and 60 mpi; and phosphorylated MPK3 and MPK6 were detected by Western blotting, using α-tubulin as an equal loading control. (D)The transcriptional levels of FRK1 and WRKY53 in Col-0, miR825/825* OE line (#50), and STTM825/825* transgenic line (#1) were evaluated by means of real-time RT-PCR. Leaves were sampled at 0, 10, 30 and 60 mpi. AtActin1 mRNA was included as an internal control. Two-way ANOVA showed significant effects of genotype on the expression of FRK1 and WRKY53 (P < 0.01 for the differences between WT and OE, and also for those between WT and STTM); and a significant treatment effect (P < 0.01) and a significant interactive effect (P < 0.01) on the expression of each tested gene. Note: NS, not significant; ** P < 0.01. The data are presented as mean ± SD from three biological replicates. The assays were repeated three times, giving similar results.
Figure 5
Figure 5
Theexpression level of target genes of miR825 and miR825* in different genotypes. (A) Expression profiles of AT5G40910, AT5G38850, AT3G04220 (miR825* targets), and AT5G44940 (a miR825 target) in Col-0, miR825/825* OE lines (#50 and #56), and STTM825/825* transgenic lines (#1 and #3) during AR156-triggered ISR. Three-week-old plants were pretreated with AR156 at 5 × 10⁸ CFU/mL or 0.85% NaCl (the control) as a root drench; at 7 dpt, leaves were challenge-inoculated as depicted above. At 48 hpi, total RNA was extracted from leaves. The data are presented as mean ± SD from three biological replicates. Two-way ANOVA indicated significant effects of genotype on the expression of AT5G40910, AT5G38850, and AT5G44940 (P < 0.01 for the differences between WT and OE, and also for those between WT and STTM) and on AT3G04220 expression (P < 0.01 and P < 0.001 for the differences between WT and OE, and between WT and STTM, respectively); and a significant treatment effect (P < 0.01) and a significant interactive effect (P < 0.01) on the expression of each tested gene. Note: NS, not significant; ** P < 0.01; *** P < 0.001. (B) Co-expression of miR825/miR825* and the four target proteins (AT5G40910, AT5G38850, AT3G04220, and AT5G44940) in a transient expression system analyzed by Western blotting. Through Agrobacterium-mediated transformation, the target proteins and miR825/825* or an irrelevant miRNA (miR319b) were co-expressed in Nicotiana benthmiana and detected at 2 dpi by using an anti-HA antibody. Here, α-tubulin served as an equal loading control. The assays were repeated three times, with similar results obtained.
Figure 6
Figure 6
The phenotype ofplants silencing miR825/825* target genes by B. cinerea infection. Three-week-oldplants of Arabidopsis Col-0 and miR825/825* target mutant lines (at5g38850, at3g04220) were pretreated with AR156 at 5 × 10⁸ CFU/mL or 0.85% NaCl (the control) as a root drench. All plants were challenge-inoculated at 7 dpt as described above. (A) Disease symptoms developed at 2 dpi on leaves of each tested plant line. (B) Necrotic lesions were assessed at 2 dpi by measuring their average diameter on one leaf per plant, with a total of three plants assessed per sample. Two-way ANOVA showed significant effects of genotype (P < 0.01) and treatment (P < 0.01) and a significant interactive effect (P < 0.01). Note: ** P < 0.01. (C) In planta fungal growthin leaves of each tested plant line. The biomass of B. cinerea B1301 was measured as depicted above and indicated as BcActin/AtActin1. Two-way ANOVA indicated significant effects of genotype (P < 0.01) and treatment (P < 0.01) and a significant interactive effect (P < 0.01). Note: ** P < 0.01. The data are presented as mean ± SD from three biological replicates. The assays were repeated three times,yielding similar results.

Similar articles

Cited by

References

    1. Chisholm S.T., Coaker G., Day B., Staskawicz B.J. Host-microbe interactions: Shaping the evolution of the plant immune response. Cell. 2006;124:803–814. doi: 10.1016/j.cell.2006.02.008. - DOI - PubMed
    1. Jones J.D., Dangl J.L. The plant immune system. Nature. 2006;444:323–329. doi: 10.1038/nature05286. - DOI - PubMed
    1. Ichimura K., Shinozaki K., Tena G., Sheen J., Henry Y., Champion A., Kreis M., Zhang S.Q., Hirt H., Wilson C., et al. Mitogen-activated protein kinase cascades in plants: A new nomenclature. Trends Plant Sci. 2002;7:301–308. - PubMed
    1. Altenbach D., Robatzek S. Pattern recognition receptors: From the cell surface to intracellular dynamics. Mol. Plant-Microbe Interact. 2007;20:1031–1039. doi: 10.1094/MPMI-20-9-1031. - DOI - PubMed
    1. Schwessinger B., Zipfel C. News from the frontline: Recent insights into PAMP-triggered immunity in plants. Curr. Opin. Plant Biol. 2008;11:389–395. doi: 10.1016/j.pbi.2008.06.001. - DOI - PubMed

MeSH terms

LinkOut - more resources