

Oxidative stress alters mitochondrial bioenergetics and modifies pancreatic cell death independently of cyclophilin D, resulting in an apoptosis-to-necrosis shift
- PMID: 29626097
- PMCID: PMC5971444
- DOI: 10.1074/jbc.RA118.003200
Oxidative stress alters mitochondrial bioenergetics and modifies pancreatic cell death independently of cyclophilin D, resulting in an apoptosis-to-necrosis shift
Abstract
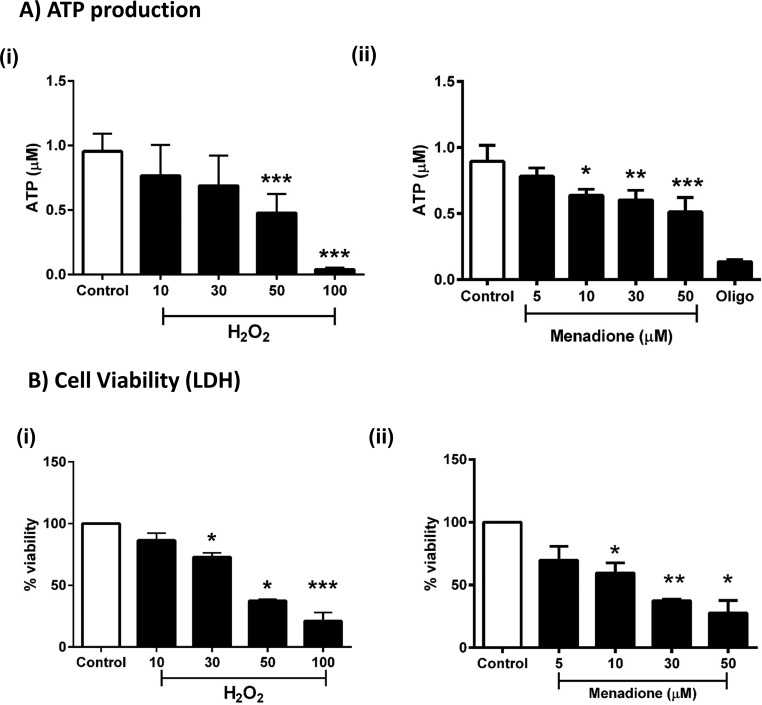
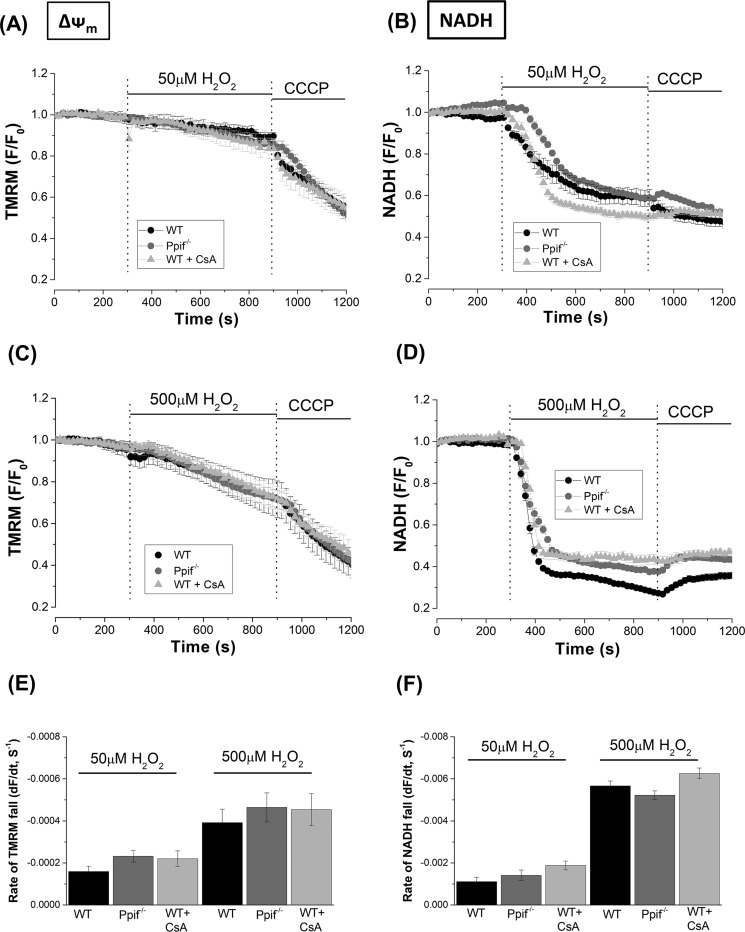
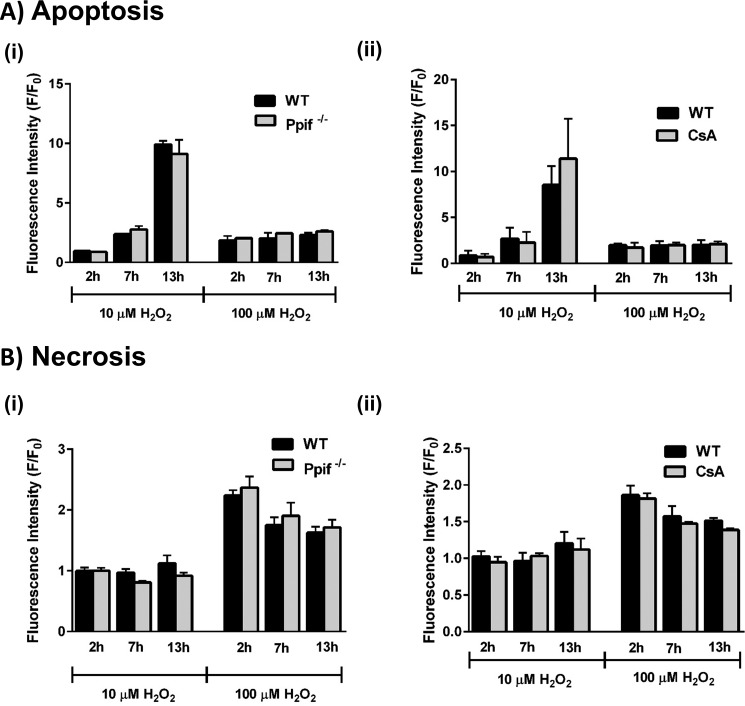
Mitochondrial dysfunction lies at the core of acute pancreatitis (AP). Diverse AP stimuli induce Ca2+-dependent formation of the mitochondrial permeability transition pore (MPTP), a solute channel modulated by cyclophilin D (CypD), the formation of which causes ATP depletion and necrosis. Oxidative stress reportedly triggers MPTP formation and is elevated in clinical AP, but how reactive oxygen species influence cell death is unclear. Here, we assessed potential MPTP involvement in oxidant-induced effects on pancreatic acinar cell bioenergetics and fate. H2O2 application promoted acinar cell apoptosis at low concentrations (1-10 μm), whereas higher levels (0.5-1 mm) elicited rapid necrosis. H2O2 also decreased the mitochondrial NADH/FAD+ redox ratio and ΔΨm in a concentration-dependent manner (10 μm to 1 mm H2O2), with maximal effects at 500 μm H2O2 H2O2 decreased the basal O2 consumption rate of acinar cells, with no alteration of ATP turnover at <50 μm H2O2 However, higher H2O2 levels (≥50 μm) diminished spare respiratory capacity and ATP turnover, and bioenergetic collapse, ATP depletion, and cell death ensued. Menadione exerted detrimental bioenergetic effects similar to those of H2O2, which were inhibited by the antioxidant N-acetylcysteine. Oxidant-induced bioenergetic changes, loss of ΔΨm, and cell death were not ameliorated by genetic deletion of CypD or by its acute inhibition with cyclosporine A. These results indicate that oxidative stress alters mitochondrial bioenergetics and modifies pancreatic acinar cell death. A shift from apoptosis to necrosis appears to be associated with decreased mitochondrial spare respiratory capacity and ATP production, effects that are independent of CypD-sensitive MPTP formation.
Keywords: Acute Pancreatitis; Seahorse; antioxidant; apoptosis; bioenergetics; cyclophilin D; mitochondrial permeability transition (MPT); necrosis (necrotic death); oxidative stress; pancreas; reactive oxygen species (ROS).
© 2018 Armstrong et al.
Conflict of interest statement
The authors declare that they have no conflicts of interest with the contents of this article
Figures


Similar articles
-
Effects of oxidative alcohol metabolism on the mitochondrial permeability transition pore and necrosis in a mouse model of alcoholic pancreatitis.Gastroenterology. 2013 Feb;144(2):437-446.e6. doi: 10.1053/j.gastro.2012.10.037. Epub 2012 Oct 24. Gastroenterology. 2013. PMID: 23103769 Free PMC article.
-
Mitochondrial Targeting of Antioxidants Alters Pancreatic Acinar Cell Bioenergetics and Determines Cell Fate.Int J Mol Sci. 2019 Apr 5;20(7):1700. doi: 10.3390/ijms20071700. Int J Mol Sci. 2019. PMID: 30959771 Free PMC article.
-
Novel mitochondrial transition pore inhibitor N-methyl-4-isoleucine cyclosporin is a new therapeutic option in acute pancreatitis.J Physiol. 2019 Dec;597(24):5879-5898. doi: 10.1113/JP278517. Epub 2019 Dec 1. J Physiol. 2019. PMID: 31631343
-
Cyclophilin D-mediated Mitochondrial Permeability Transition Regulates Mitochondrial Function.Curr Pharm Des. 2023;29(8):620-629. doi: 10.2174/1381612829666230313111314. Curr Pharm Des. 2023. PMID: 36915987 Review.
-
Regulation of necrotic cell death: p53, PARP1 and cyclophilin D-overlapping pathways of regulated necrosis?Cell Mol Life Sci. 2016 Jun;73(11-12):2309-24. doi: 10.1007/s00018-016-2202-5. Epub 2016 Apr 5. Cell Mol Life Sci. 2016. PMID: 27048819 Free PMC article. Review.
Cited by
-
Genetic Suppressor Element 1 (GSE1) Promotes the Oncogenic and Recurrent Phenotypes of Castration-Resistant Prostate Cancer by Targeting Tumor-Associated Calcium Signal Transducer 2 (TACSTD2).Cancers (Basel). 2021 Aug 5;13(16):3959. doi: 10.3390/cancers13163959. Cancers (Basel). 2021. PMID: 34439112 Free PMC article.
-
Teriflunomide preserves peripheral nerve mitochondria from oxidative stress-mediated alterations.Ther Adv Chronic Dis. 2020 Aug 11;11:2040622320944773. doi: 10.1177/2040622320944773. eCollection 2020. Ther Adv Chronic Dis. 2020. PMID: 32850106 Free PMC article.
-
Mitochondrial Inorganic Polyphosphate (polyP) Is a Potent Regulator of Mammalian Bioenergetics in SH-SY5Y Cells: A Proteomics and Metabolomics Study.Front Cell Dev Biol. 2022 Feb 17;10:833127. doi: 10.3389/fcell.2022.833127. eCollection 2022. Front Cell Dev Biol. 2022. PMID: 35252194 Free PMC article.
-
The Contribution of the 20S Proteasome to Proteostasis.Biomolecules. 2019 May 16;9(5):190. doi: 10.3390/biom9050190. Biomolecules. 2019. PMID: 31100951 Free PMC article. Review.
-
Neuronal Metabolism and Neuroprotection: Neuroprotective Effect of Fingolimod on Menadione-Induced Mitochondrial Damage.Cells. 2020 Dec 29;10(1):34. doi: 10.3390/cells10010034. Cells. 2020. PMID: 33383658 Free PMC article.
References
-
- Peery A. F., Crockett S. D., Barritt A. S., Dellon E. S., Eluri S., Gangarosa L. M., Jensen E. T., Lund J. L., Pasricha S., Runge T., Schmidt M., Shaheen N. J., and Sandler R. S. (2015) Burden of gastrointestinal, liver, and pancreatic diseases in the United States. Gastroenterology 149, 1731–1741 10.1053/j.gastro.2015.08.045 - DOI - PMC - PubMed
-
- Mukherjee R., Mareninova O. A., Odinokova I. V., Huang W., Murphy J., Chvanov M., Javed M. A., Wen L., Booth D. M., Cane M. C., Awais M., Gavillet B., Pruss R. M., Schaller S., Molkentin J. D., et al. (2016) Mechanism of mitochondrial permeability transition pore induction and damage in the pancreas: inhibition prevents acute pancreatitis by protecting production of ATP. Gut 65, 1333–1346 10.1136/gutjnl-2014-308553 - DOI - PMC - PubMed
Publication types
MeSH terms
Substances
Grants and funding
LinkOut - more resources
Full Text Sources
Other Literature Sources
Molecular Biology Databases
Miscellaneous
