Abstract analysis method facilitates filtering low-methodological quality and high-bias risk systematic reviews on psoriasis interventions
- PMID: 29284417
- PMCID: PMC5747101
- DOI: 10.1186/s12874-017-0460-z
Abstract analysis method facilitates filtering low-methodological quality and high-bias risk systematic reviews on psoriasis interventions
Abstract
Background: Article summaries' information and structure may influence researchers/clinicians' decisions to conduct deeper full-text analyses. Specifically, abstracts of systematic reviews (SRs) and meta-analyses (MA) should provide structured summaries for quick assessment. This study explored a method for determining the methodological quality and bias risk of full-text reviews using abstract information alone.
Methods: Systematic literature searches for SRs and/or MA about psoriasis were undertaken on MEDLINE, EMBASE, and Cochrane database. For each review, quality, abstract-reporting completeness, full-text methodological quality, and bias risk were evaluated using Preferred Reporting Items for Systematic Reviews and Meta-analyses for abstracts (PRISMA-A), Assessing the Methodological Quality of Systematic Reviews (AMSTAR), and ROBIS tools, respectively. Article-, author-, and journal-derived metadata were systematically extracted from eligible studies using a piloted template, and explanatory variables concerning abstract-reporting quality were assessed using univariate and multivariate-regression models. Two classification models concerning SRs' methodological quality and bias risk were developed based on per-item and total PRISMA-A scores and decision-tree algorithms. This work was supported, in part, by project ICI1400136 (JR). No funding was received from any pharmaceutical company.
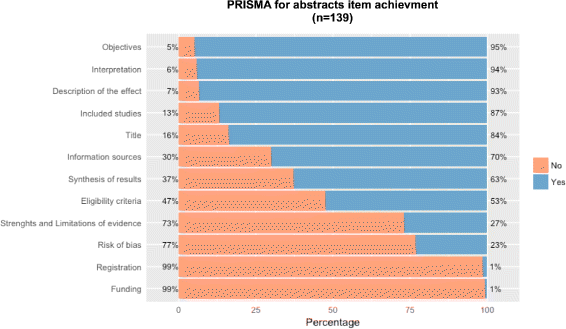
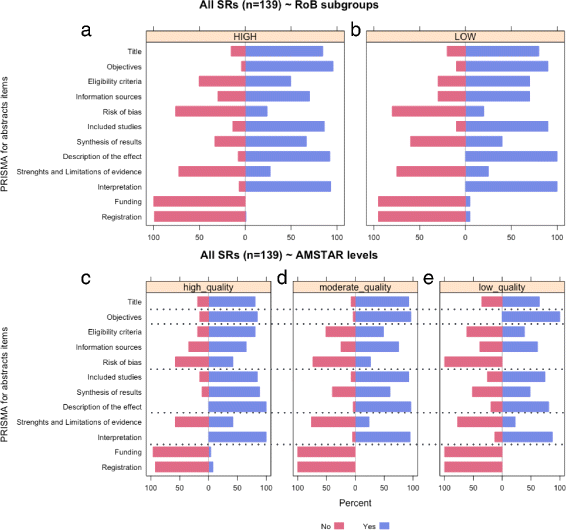
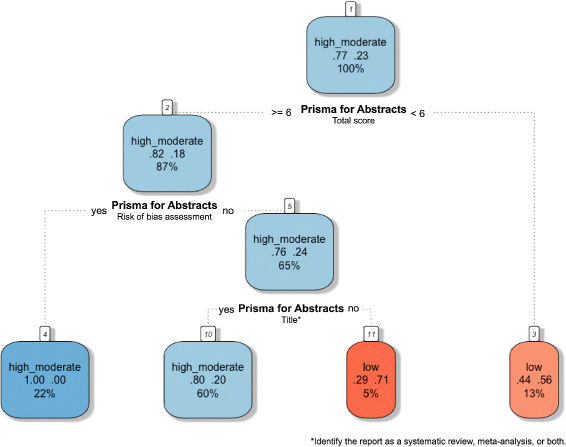
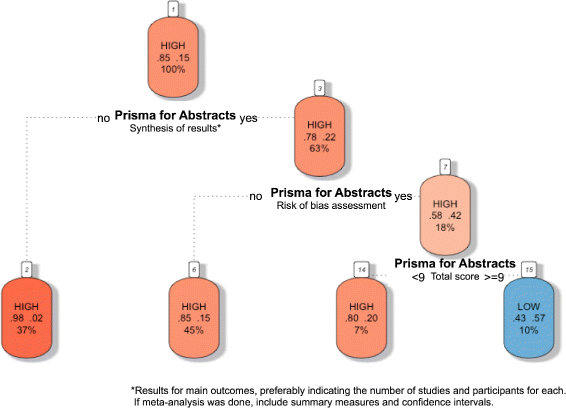
Results: This study analysed 139 SRs on psoriasis interventions. On average, they featured 56.7% of PRISMA-A items. The mean total PRISMA-A score was significantly higher for high-methodological-quality SRs than for moderate- and low-methodological-quality reviews. SRs with low-bias risk showed higher total PRISMA-A values than reviews with high-bias risk. In the final model, only 'authors per review > 6' (OR: 1.098; 95%CI: 1.012-1.194), 'academic source of funding' (OR: 3.630; 95%CI: 1.788-7.542), and 'PRISMA-endorsed journal' (OR: 4.370; 95%CI: 1.785-10.98) predicted PRISMA-A variability. Reviews with a total PRISMA-A score < 6, lacking identification as SR or MA in the title, and lacking explanation concerning bias risk assessment methods were classified as low-methodological quality. Abstracts with a total PRISMA-A score ≥ 9, including main outcomes results and explanation bias risk assessment method were classified as having low-bias risk.
Conclusions: The methodological quality and bias risk of SRs may be determined by abstract's quality and completeness analyses. Our proposal aimed to facilitate synthesis of evidence evaluation by clinical professionals lacking methodological skills. External validation is necessary.
Keywords: AMSTAR; Abstract readability; Decision trees; Methodological quality; PRISMA for abstracts; Psoriasis; Quality of reporting; Systematic review.
Conflict of interest statement
Ethics approval and consent to participate
Since our study did not collect primary data, no formal ethical assessment or informed consent were required.
Consent for publication
Not applicable.
Competing interests
FG-G has received honoraria for research from Pfizer, and for lecturing from AbbVie, Janssen-Cilag and Novartis; JR has received honoraria for lecturing and grants for research from Pfizer, honoraria for lecturing from Janssen-Cilag and Novartis, and other financial benefits from AbbVie and Novartis; AVG-N has received honoraria for lecturing from Pfizer, Novartis, AbbVie, and Janssen-Cilag, and other financial benefits from AbbVie, No- vartis, and Janssen-Cilag; JG-M, MA-L, JLS-C, PA-M, BM-L, PJC-F, MG-P, and BI-T have no disclosures. MA-L, JR, FG-G, and BI-T are members of the Cochrane Bias Methods Group and Skin Group.
Publisher’s Note
Springer Nature remains neutral with regard to jurisdictional claims in published maps and institutional affiliations.
Figures
Similar articles
-
Assessment of the abstract reporting of systematic reviews of dose-response meta-analysis: a literature survey.BMC Med Res Methodol. 2019 Jul 15;19(1):148. doi: 10.1186/s12874-019-0798-5. BMC Med Res Methodol. 2019. PMID: 31307388 Free PMC article. Review.
-
Relationships between abstract features and methodological quality explained variations of social media activity derived from systematic reviews about psoriasis interventions.J Clin Epidemiol. 2018 Sep;101:35-43. doi: 10.1016/j.jclinepi.2018.05.015. Epub 2018 May 25. J Clin Epidemiol. 2018. PMID: 29803759
-
Most systematic reviews of high methodological quality on psoriasis interventions are classified as high risk of bias using ROBIS tool.J Clin Epidemiol. 2017 Dec;92:79-88. doi: 10.1016/j.jclinepi.2017.08.015. Epub 2017 Sep 9. J Clin Epidemiol. 2017. PMID: 28893571
-
Reporting and Methodological Quality of Systematic Reviews and Meta-Analyses of Nursing Interventions in Patients With Alzheimer's Disease: General Implications of the Findings.J Nurs Scholarsh. 2019 May;51(3):308-316. doi: 10.1111/jnu.12462. Epub 2019 Feb 25. J Nurs Scholarsh. 2019. PMID: 30806019
-
Systematic reviews in orthodontics: Impact of the PRISMA for Abstracts checklist on completeness of reporting.Am J Orthod Dentofacial Orthop. 2019 Oct;156(4):442-452.e12. doi: 10.1016/j.ajodo.2019.05.009. Am J Orthod Dentofacial Orthop. 2019. PMID: 31582116 Review.
Cited by
-
Assessment of the abstract reporting of systematic reviews of dose-response meta-analysis: a literature survey.BMC Med Res Methodol. 2019 Jul 15;19(1):148. doi: 10.1186/s12874-019-0798-5. BMC Med Res Methodol. 2019. PMID: 31307388 Free PMC article. Review.
-
Factors associated with the reporting quality of low back pain systematic review abstracts in physical therapy: a methodological study.Braz J Phys Ther. 2021 May-Jun;25(3):233-241. doi: 10.1016/j.bjpt.2020.10.002. Epub 2020 Nov 11. Braz J Phys Ther. 2021. PMID: 33246869 Free PMC article. Review.
References
-
- Gómez-García F, Epstein D, Isla-Tejera B, Lorente A, Vélez García-Nieto A, Ruano J. Short-term efficacy and safety of new biological agents targeting the interleukin-23-T helper 17 pathway for moderate-to-severe plaque psoriasis: a systematic review and network meta-analysis. Br J Dermatol. 2017;176:594–603. doi: 10.1111/bjd.14814. - DOI - PubMed
Publication types
MeSH terms
Grants and funding
LinkOut - more resources
Full Text Sources
Other Literature Sources
Medical
Research Materials

