. 2014 Jun 27;289(26):18189-201.
doi: 10.1074/jbc.M114.561944. Epub 2014 May 12.

A substrate preference for the rough endoplasmic reticulum resident protein FKBP22 during collagen biosynthesis

Affiliations

A substrate preference for the rough endoplasmic reticulum resident protein FKBP22 during collagen biosynthesis

Yoshihiro Ishikawa et al. J Biol Chem. .

Abstract

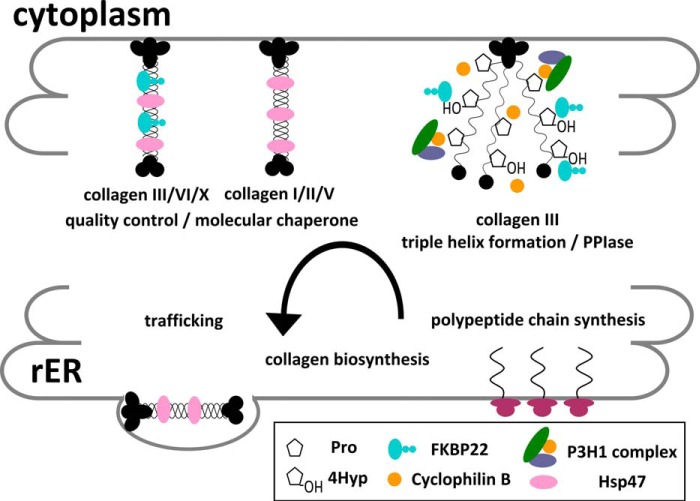
The biosynthesis of collagens occurs in the rough endoplasmic reticulum and requires a large numbers of molecular chaperones, foldases, and post-translational modification enzymes. Collagens contain a large number of proline residues that are post-translationally modified to 3-hydroxyproline or 4-hydroxyproline, and the rate-limiting step in formation of the triple helix is the cis-trans isomerization of peptidyl-proline bonds. This step is catalyzed by peptidyl-prolyl cis-trans isomerases. There are seven peptidyl-prolyl cis-trans isomerases in the rER, and so far, two of these enzymes, cyclophilin B and FKBP65, have been shown to be involved in collagen biosynthesis. The absence of either cyclophilin B or FKBP65 leads to a recessive form of osteogenesis imperfecta. The absence of FKBP22 leads to a kyphoscoliotic type of Ehlers-Danlos syndrome (EDS), and this type of EDS is classified as EDS type VI, which can also be caused by a deficiency in lysyl-hydroxylase 1. However, the lack of FKBP22 shows a wider spectrum of clinical phenotypes than the absence of lysyl-hydroxylase 1 and additionally includes myopathy, hearing loss, and aortic rupture. Here we show that FKBP22 catalyzes the folding of type III collagen and interacts with type III collagen, type VI collagen, and type X collagen, but not with type I collagen, type II collagen, or type V collagen. These restrictive interactions might help explain the broader phenotype observed in patients that lack FKBP22.

Keywords: Biosynthesis; Collagen; Endoplasmic Reticulum (ER); FK506-binding Protein; Molecular Chaperone; Peptidyl-Prolyl Cis-Trans Isomerase; Protein Folding.


Figures

FIGURE 1.
FIGURE 1.
Characterization of purified human FKBP22. A, SDS-PAGE analysis of purified recombinant human FKBP22. Human FKBP22 was purified from an E. coli expression system, and the figure shows the final purified material in the presence and absence of dithiothreitol for lanes 1 and 2, respectively. The purified FKBP22 was run on NuPAGE Novex BisTris 12% gel (Invitrogen) and stained with GelCode Blue Stain Reagent. *, blank lane. B, circular dichroism spectra of FKBPs. The circular dichroism spectrum was measured at 4 °C in 1 mm Tris/HCl, pH 7.5, containing 0.05 mm CaCl2. The concentration of human FKBP22 (green) was 0.05 mg/ml. The spectra for human FKBP12 (black) and chick FKBP65 (red) are included for comparison.
FIGURE 2.
FIGURE 2.
Interaction of FKBP22 with collagens. Fibril formation of type I (A) and type III (B) collagen in the presence and absence of Hsp47 or FKBP22. A stock solution of type I and type III collagen in 50 mm acetic acid was diluted to a final concentration of 0.1 and 0.2 μm, respectively. The measurements were performed in 0.1 m sodium bicarbonate buffer, pH 7.8, containing 0.15 m NaCl and 1 mm CaCl2 at 34 °C. Hsp47 was used as a positive control. A, the curves indicate the absence (black) and presence of 0.05 μm Hsp47 (red) and 0.2 μm FKBP22 (green). B, the curves indicate the absence (black) and presence of 0.05 μm Hsp47 (red) and 0.05 μm (green) and 0.1 μm (blue) FKBP22. Shown are thermal melting curves of type I collagen (C) and full-length type III collagen (D) in the presence (blue) and absence (red) of FKBP22. The final protein concentrations were 0.2 and 0.6 μm for collagens and FKBP22, respectively. The melting curves in the presence of FKBP22 are shown after subtraction of the FKBP22-only melting curve.
FIGURE 3.
FIGURE 3.
Refolding of full-length type III collagen in the presence and absence of FKBP22. Type III collagen was denatured for 5 min at 45 °C and then refolded at 25 °C for 90 min. Refolding was monitored by optical rotatory dispersion at 365 nm. The increased slope of the linear refolding phase indicates catalysis of the cis-trans isomerization. The final concentrations of type III collagen and FKBP22 were 0.075 and 0.75 μm, respectively.
FIGURE 4.
FIGURE 4.
Refolding of the quarter fragment of type III collagen with and without prolyl 4-hydroxylation in the presence and absence of FKBP22. Refolding was monitored by a circular dichroism spectrum at 220 nm. Protein concentrations were 2 and 6 μm for the quarter fragments of type III collagens and FKBP22, respectively. A, refolding of the prolyl 4-hydroxylated quarter fragment of type III collagen in the presence (blue) and absence (red) of FKBP22. The black curve represents FKBP22 by itself. B, determination of the initial folding rate of prolyl 4-hydroxylated quarter fragment of type III collagen in the presence (blue) and absence (red) of FKBP22. Open circles and solid straight lines, raw data points and calculated initial folding rate from A, respectively. The slope of the straight lines reflected the initial rate of folding of prolyl 4-hydroxylated quarter fragment of type III collagen. Open black circles, raw data points of FKBP22 alone. C, refolding of non-4-hydroxylated quarter fragment of type III collagen in the presence (blue) and absence (red) of FKBP22. D, the determination of initial folding kinetics of the non-4-hydroxylated quarter fragment of type III collagen in presence (blue) and absence (red) of FKBP22. Open circles and solid straight lines, raw data points and calculated initial folding rate from C, respectively. The slope of the straight line reflected the initial rate of folding of the non-hydroxylated quarter fragment of type III collagen.
FIGURE 5.
FIGURE 5.
Influence of FK506 on the structure and PPIase activity of FKBP22. A, fluorescence spectra of 15 nm FKBP22 in presence (dotted line) and absence (solid line) of 150 nm FK506 resulting from tryptophan fluorescence at 280-nm excitation. Inset, background absorbance of 300 nm FK506 at 280 nm. B, titration curve of free FKBP22 in the presence of various concentrations of FK506. Free FKBP22 was calculated using the fluorescence signal at 340 nm. The concentration of FKBP22 was 15 nm. C, effect of FK506 on the refolding of full-length type III collagen monitored by CD at 220 nm. The protein concentrations were 0.2 and 2.0 μm for full-length type III collagen and FKBP22, respectively. FKBP22 was preincubated with 10 μm FK506 for 5 min at room temperature. Refolding of type III collagen with DMSO is shown in the presence (blue) and absence (black) of FKBP22 or with FK506 in the presence (green) and absence (red) of FKBP22. FKBP22 alone with DMSO (magenta) and with FK506 (cyan) are also shown.
FIGURE 6.
FIGURE 6.
The effect of calcium on the FKBP22 structure and activity. A, circular dichroism spectra of FKBP22 in the presence (red) and absence (blue) of calcium are shown. The circular dichroism spectra were measured at 4 °C in 1 mm Tris/HCl, pH 7.5, treated with Chelex 100 resin, analytical grade. The concentration of both Chelex-treated and untreated FKBP22 was 8.4 μm. B, effect of calcium on the refolding of full-length type III collagen monitored by CD at 220 nm. The protein concentrations were 0.2 and 2.0 μm for full-length type III collagen and FKBP22, respectively. Refolding of type III collagen in the presence of FKBP22 with (red) and without (blue) calcium is shown. Type III collagen alone (black) or FKBP22 alone with (green) and without (cyan) calcium is also shown.
FIGURE 7.
FIGURE 7.
Classical chaperone activity assays using model substrates. A, the thermal aggregation of citrate synthase was monitored at 500 nm. A 30 μm citrate synthase solution was diluted 200-fold into prewarmed 40 mm Hepes buffer, pH 7.5, at 43 °C. The curves present the absence (black) and presence of 0.1 μm protein-disulfide isomerase (blue) and 0.5 μm FKBP22 (red). B, chemically denatured citrate synthase was diluted 100-fold (0.15 μm final concentration) into 30 mm Tris/HCl buffer, pH 7.2, containing 50 mm NaCl. Absorbance (light scattering) was monitored at 500 nm. The curves present the absence (black) and presence of 0.15 μm protein-disulfide isomerase (blue) and 0.25 μm FKBP22 (red). C, chemically denatured rhodanese was diluted 100-fold (0.2 μm final concentration) into 30 mm Tris/HCl buffer, pH 7.2, containing 50 mm NaCl. Absorbance (light scattering) was monitored at 320 nm. The curves present the absence (black) and presence of 0.1 μm (red), 0.2 μm (blue), and 0.3 μm (green) FKBP22.
FIGURE 8.
FIGURE 8.
Direct binding kinetics of FKBP22 to collagens. Direct binding kinetics were monitored by surface plasmon resonance analysis using a BIAcore X instrument. A, 40 μm FKBP22 (red) and 0.05 μm Hsp47 (blue) as positive control were injected over a CM5 chip with immobilized bovine type I collagen. B, 25 μm FKBP22 (red) and 0.1 μm Hsp47 (blue) as positive control were injected over a CM5 chip with immobilized bovine type II collagen. C, 60 μm FKBP22 (red) and 0.05 μm Hsp47 (blue) as positive control were injected over a CM5 chip with immobilized bovine type III collagen. D, 30 μm FKBP22 (red) and 0.3 μm Hsp47 (blue) as positive control were injected over a CM5 chip with immobilized bovine type V collagen. E, 30 μm FKBP22 (red) and 0.3 μm Hsp47 (blue) as positive control were injected over a CM5 chip with immobilized human type VI collagen. F, 24 μm FKBP22 (red) and 0.4 μm Hsp47 (blue) as positive control were injected over CM5 chip-immobilized human type X collagen. G, various concentrations of FKBP22 were run over the type III collagen chip. The following binding curves are shown: 60 μm (black), 40 μm (red), 30 μm (blue), and 20 μm (green) FKBP22. H, various concentrations of FKBP22 were run over the type VI collagen chip. The following binding curves are shown: 30 μm (black), 24 μm (red), 18 μm (blue), and 12 μm (green) FKBP22. I, various concentrations of FKBP22 were run over the type X collagen chip. The following binding curves are shown: 24 μm (black), 16 μm (red), 12 μm (blue), and 8 μm (green) FKBP22.
FIGURE 9.
FIGURE 9.
Schematic diagram of the functions of FKBP22 during collagen biosynthesis in the rER. The PPIase and molecular chaperone activity are shown in the collagen biosynthesis steps with potential substrates.

Similar articles

Cited by

References

    1. Bächinger H. P., Mizuno K., Vranka J., Boudko S. (2010) Collagen Formation and Structure. in Comprehensive Natural Products II: Chemistry and Biology (Mander L., Liu H.-W., eds) pp. 469–530, Elsevier, Oxford
    1. Bateman J. F., Boot-Handford R. P., Lamandé S. R. (2009) Genetic diseases of connective tissues: cellular and extracellular effects of ECM mutations. Nat. Rev. Genet. 10, 173–183 - PubMed
    1. Makareeva E., Aviles N. A., Leikin S. (2011) Chaperoning osteogenesis: new protein-folding disease paradigms. Trends Cell Biol. 21, 168–176 - PMC - PubMed
    1. Ishikawa Y., Bächinger H. P. (2013) A molecular ensemble in the rER for procollagen maturation. Biochim. Biophys. Acta 1833, 2479–2491 - PubMed
    1. Eyre D. R., Weis M. A. (2013) Bone collagen: new clues to its mineralization mechanism from recessive osteogenesis imperfecta. Calcif. Tissue Int. 93, 338–347 - PMC - PubMed

Publication types

MeSH terms