. 2013 Aug;24(16):2558-69.
doi: 10.1091/mbc.E13-03-0170. Epub 2013 Jul 3.

Interaction between AP-5 and the hereditary spastic paraplegia proteins SPG11 and SPG15

Affiliations

Interaction between AP-5 and the hereditary spastic paraplegia proteins SPG11 and SPG15

Jennifer Hirst et al. Mol Biol Cell. 2013 Aug.

Abstract

The AP-5 complex is a recently identified but evolutionarily ancient member of the family of heterotetrameric adaptor proteins (AP complexes). It is associated with two proteins that are mutated in patients with hereditary spastic paraplegia, SPG11 and SPG15. Here we show that the four AP-5 subunits can be coimmunoprecipitated with SPG11 and SPG15, both from cytosol and from detergent-extracted membranes, with a stoichiometry of ∼1:1:1:1:1:1. Knockdowns of SPG11 or SPG15 phenocopy knockdowns of AP-5 subunits: all six knockdowns cause the cation-independent mannose 6-phosphate receptor to become trapped in clusters of early endosomes. In addition, AP-5, SPG11, and SPG15 colocalize on a late endosomal/lysosomal compartment. Both SPG11 and SPG15 have predicted secondary structures containing α-solenoids related to those of clathrin heavy chain and COPI subunits. SPG11 also has an N-terminal, β-propeller-like domain, which interacts in vitro with AP-5. We propose that AP-5, SPG15, and SPG11 form a coat-like complex, with AP-5 involved in protein sorting, SPG15 facilitating the docking of the coat onto membranes by interacting with PI3P via its FYVE domain, and SPG11 (possibly together with SPG15) forming a scaffold.


Figures
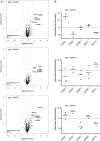
FIGURE 1:
FIGURE 1:
Stable association of SPG11 and SPG15 with AP-5. (A) QUBIC interaction proteomic analysis. GFP-tagged AP-5 ζ, SPG11, and SPG15 were stably expressed under the control of their endogenous promoters. Immunoprecipitations were performed with an anti-GFP antibody and compared by label-free quantitative mass spectrometry with immunoprecipitations (IPs) performed on a control cell line with no GFP bait protein. Every experiment was performed in triplicate. Data were analyzed with a t test to determine significant interactions (Hubner et al., 2010) and visualized in a “volcano plot.” For each identified protein, plots show the fold difference in abundance (bait IP vs. control IP; x-axis, log2 scale), as well as a p-value indicating robustness of the observed difference (y-axis, –log10 scale). Specific interactors have high fold differences and low p values (top right quadrant of the plot). The “volcano” lines indicate the significance cut-off that separates specific interactors from background. With every bait, all four AP-5 subunits, SPG11, and SPG15 are specifically coimmunoprecipitated. The SPG11 bait also coIPs a number of abundant cytoskeletal proteins, but since these proteins were not identified in the other two QUBIC experiments, it seems unlikely that these interactions are physiologically relevant. Furthermore, the SPG11 pull down has a greater scatter of background proteins than the AP-5 ζ and SGP15 pull downs, suggesting that it may be slightly less specific. (B) Stoichiometry analysis. Normalized peptide intensities were used to estimate the relative abundance of specific interactors identified in A (iBAQ method; Schwanhäusser et al., 2011). For each protein, the values from all triplicate repeats were plotted. Only coimmunoprecipitated proteins were included, since the bait protein tends to be overrepresented in immunoprecipitation experiments. The relative abundances of proteins were normalized to the median abundance of all proteins across each experiment (i.e., median set to 1.0). The data show that regardless of the bait protein, roughly equal molar amounts of AP-5 subunits, SPG11, and SPG15 are coprecipitated, which supports the existence of an equimolar hexameric complex consisting of AP-5, SPG11, and SPG15. The only exception is a substantially higher proportion of AP-5 σ precipitated with AP-5 ζ (top). Based on structural information on other AP complexes (Page and Robinson, 1995; Collins et al., 2002), these two subunits may form a stable subcomplex, and expression of tagged AP-5 ζ may thus stabilize and increase the recovery of AP-5 σ.
FIGURE 2:
FIGURE 2:
Western blots of immunoprecipitates. (A) Immunoprecipitations were carried out on either control HeLa cells or HeLa cells expressing SPG15-GFP using anti-GFP, and the blots were probed using antibodies against AP-5 subunits. AP-5 coprecipitates with SPG15-GFP in both a high-speed supernatant of homogenized cells (SUP) and a Triton X-100 extract of a high-speed pellet (PEL), indicating that the association occurs both in cytosol and on membranes. The lower–molecular weight band in the immunoprecipitates probed with anti-β5 appears to be nonspecific. (B) A cytosol fraction from SPG15-GFP–expressing cells was immunoprecipitated with the antibodies indicated at the top, and Western blots were probed with the antibodies indicated at the side. Although AP-5 coimmunoprecipitates with SPG15-GFP, AP-1 and AP-2 do not coimmunoprecipitate with clathrin heavy chain (CHC). The input is 2.5% relative to the IP for SPG15-GFP and 5% for CHC, AP-1, and AP-2.
FIGURE 3:
FIGURE 3:
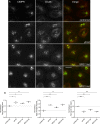
Knockdown of SPG11 and SPG15 phenocopies AP-5 knockdown. (A) HeLa cells were treated with siRNAs as indicated and double labeled for the CIMPR and the retromer protein Vps26. In the siRNA-treated cells, the CIMPR clusters in Vps26-positive endosomes. There also appears to be increased colocalization of CIMPR and Vps26 in these cells. All of the images of siRNA-treated cells were taken at half the exposure time of the controls because of the increased brightness. Scale bar, 20 μm. (B) The knockdown phenotypes were quantified using an ArrayScan VTI microscope and Spot Detector V4 algorithm application for automated image collection and analysis. Means of CIMPR labeling in control and knockdown cells were compared using repeated-measures analysis of variance and the post hoc Tukey–Kramer significance test (*p < 0.05, **p < 0.01, ***p < 0.001). More than 1500 cells were scored per knockdown condition (two independent repeats). In every knockdown, there is an increase in the area and intensity of spots and a concomitant decrease in the number of spots (although the decrease in spot number could be a result of increased clustering rather than fewer structures).
FIGURE 4:
FIGURE 4:
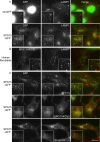
Immunofluorescence labeling of AP-5, SPG15, and SPG11. (A) Cells stably expressing either σ5-GFP or SPG15-GFP were fixed and double labeled with antibodies against GFP (to enhance the signal) and the late endosomal/lysosomal protein LAMP1. Cytosolic σ5-GFP was washed out by saponin before fixation, leaving nuclear staining (this construct is likely to diffuse freely in and out of the nucleus). The punctate GFP labeling throughout the cytoplasm is partially coincident with LAMP1. (B) Primary human fibroblasts were double labeled for endogenous SPG11 and LAMP1. The two antibodies show good colocalization. (C) Cells expressing SPG15-GFP were fixed and double labeled with anti-GFP and monoclonal antibodies against either SPG11 or ζ subunit of AP-5. The labeling patterns for tagged SPG15 and endogenous ζ or SPG11 are largely coincident. Scale bars, 20 μm.
FIGURE 5:
FIGURE 5:
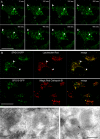
SPG15 localization. (A) Stills from a movie (Supplemental Movie S1) showing cells expressing SPG15-GFP. Cells were imaged every 10 s over 15 min. Motile structures can be seen moving over short (arrows) and long distances (circle). Scale bar, 20 μm. (See Supplemental Movie S1.) (B) Cells expressing SPG15-GFP were either incubated with Lysotracker Red, a vital stain for acidic organelles, and imaged immediately, or incubated with Magic Red Cathepsin B substrate, a vital stain for active lysosomal hydrolases, for 30 min and then imaged. SPG15-GFP colocalizes with both markers. Scale bar: 20 μm. (See Supplemental Movies S2 and S3.) (C) Immunogold labeling of SPG15-GFP–expressing cells. Because of the low abundance of the protein, labeling was sparse, but there was very little background. Gold particles can be seen associated with organelles containing membrane whorls, characteristic of late endosomes/lysosomes, but we did not find any label associated with budding profiles. Scale bar, 200 nm.
FIGURE 6:
FIGURE 6:
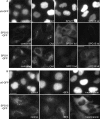
Localization of AP-5 depends on SPG11/SPG15 and is sensitive to wortmannin. (A) Cells stably expressing σ5-GFP, SPG15-GFP, or SPG11-GFP were treated with siRNAs and then labeled with anti-GFP. The σ5-GFP–expressing cells were treated with saponin before fixation to wash out cytosolic proteins. The punctate labeling of σ5-GFP is lost when ζ, SPG11, or SPG15 is depleted. In contrast, the punctate labeling of SPG15-GFP or SPG11-GFP is not lost when ζ is depleted. SPG15 labeling becomes diffuse when SPG11 is depleted, however, and SPG11 labeling becomes diffuse when SPG15 is depleted. In both cases, siRNAs targeting the construct itself (plus the endogenous version of the protein) strongly reduce the total fluorescence. (B) Cells stably expressing either SPG15-GFP or σ5-GFP were treated with 5 μg/ml brefeldin A (BFA) for 5 min or 100 nM wortmannin for 1 h and then fixed. The σ5-GFP–expressing cells were treated with saponin to wash out cytosolic proteins before fixation. The punctate labeling of both proteins is insensitive to brefeldin A but is lost upon treatment with wortmannin. Scale bars, 20 μm.
FIGURE 7:
FIGURE 7:
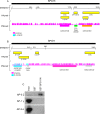
Domain organization of SPG15 and SPG11. (A) The domain organization of SPG15 was predicted by DOMpred, and then homology searching with each domain was carried out using HHpred (http://toolkit.tuebingen.mpg.de/hhpred). More information about the HHpred hits is available in Supplemental Table S2. PSIpred was used to carry out a secondary structure prediction for each residue. The α-helices are in magenta and β-strands in cyan. The height of each colored vertical line is proportional to the confidence of the secondary structure prediction (McGuffin et al., 2000). (B) A similar analysis was carried out on SPG11. (C) GST alone or the N-terminal domain of SPG11 coupled to GST was incubated with HeLa cell cytosol, and bound AP-5 ζ was detected by Western blotting. The N-terminal domain of SPG11 (GST-SPG11N) pulls down AP-5 ζ from cytosol. We estimate, however, that no more than ∼10% of the total AP-5 ζ was pulled down by the SPG11 construct, probably because most of the AP-5 already has SPG11 stably associated with it, so the pull down only captures “unoccupied” AP-5. As controls, blots of the cytosol and pull downs were also probed with antibodies against the AP-1 γ and AP-2 α subunits. Although both of these proteins are much more abundant in cytosol than AP-5 ζ, neither was detected in the GST-SPG11N pull down.

Similar articles

Cited by

References

    1. Antrobus R, Borner GHH. Improved elution conditions for native co-immunoprecipitation. PLoS One. 2011;23:e18218. - PMC - PubMed
    1. Arike L, Valgepea K, Peil L, Nahku R, Adamberg K, Vilu R. Comparison and applications of label-free absolute proteome quantification methods on Escherichia coli. J Proteomics. 2012;75:5437–5448. - PubMed
    1. Beck KA, Keen JH. Interaction of phosphoinositide cycle intermediates with the plasma membrane-associated clathrin assembly protein AP-2. J Biol Chem. 1991;266:4442–4447. - PubMed
    1. Bettencourt C, et al. Exome sequencing is a useful diagnostic tool for complicated forms of hereditary spastic paraplegia. Clin Genet. 2013 doi: 10.1111/cge.12133. - PubMed
    1. Boukhris A, et al. Hereditary spastic paraplegia with mental impairment and thin corpus callosum in Tunisia: SPG11, SPG15, and further genetic heterogeneity. Arch Neurol. 2008;65:393–402. - PubMed

MeSH terms