Clinical Trial
. 2013 Apr 8;210(4):683-97.
doi: 10.1084/jem.20121798. Epub 2013 Mar 25.

Specific Notch receptor-ligand interactions control human TCR-αβ/γδ development by inducing differential Notch signal strength

Affiliations
Clinical Trial

Specific Notch receptor-ligand interactions control human TCR-αβ/γδ development by inducing differential Notch signal strength

Inge Van de Walle et al. J Exp Med. .

Abstract

In humans, high Notch activation promotes γδ T cell development, whereas lower levels promote αβ-lineage differentiation. How these different Notch signals are generated has remained unclear. We show that differential Notch receptor-ligand interactions mediate this process. Whereas Delta-like 4 supports both TCR-αβ and -γδ development, Jagged1 induces mainly αβ-lineage differentiation. In contrast, Jagged2-mediated Notch activation primarily results in γδ T cell development and represses αβ-lineage differentiation by inhibiting TCR-β formation. Consistently, TCR-αβ T cell development is rescued through transduction of a TCR-β transgene. Jagged2 induces the strongest Notch signal through interactions with both Notch1 and Notch3, whereas Delta-like 4 primarily binds Notch1. In agreement, Notch3 is a stronger Notch activator and only supports γδ T cell development, whereas Notch1 is a weaker activator supporting both TCR-αβ and -γδ development. Fetal thymus organ cultures in JAG2-deficient thymic lobes or with Notch3-blocking antibodies confirm the importance of Jagged2/Notch3 signaling in human TCR-γδ differentiation. Our findings reveal that differential Notch receptor-ligand interactions mediate human TCR-αβ and -γδ T cell differentiation and provide a mechanistic insight into the high Notch dependency of human γδ T cell development.


Figures
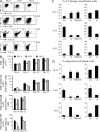
Figure 1.
Figure 1.
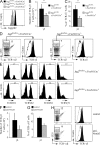
Notch ligands differentially impact TCR-αβ versus TCR-γδ T cell development. (A) Kinetic flow cytometric analysis of CD34+CD4CD1a uncommitted intrathymic progenitors cultured for 11 or 18 d on OP9 cells expressing the different Notch ligands (DLL4, JAG1, or JAG2) as indicated above the dot plots. Numbers in the quadrants indicate the percentage of the corresponding populations. Dot plots shown are representative of three independent experiments. (B–E) Corresponding cell numbers of the kinetic flow cytometric analysis of cultures depicted in A. Graphs show the absolute number of all cells (B), CD4+CD8β+ DP cells (C), CD3+TCR-γδ+ (D), and CD3+TCR-αβ+ cells (E). Data shows the mean of three independent experiments and error bars show SEM. (F and G) Relative (F) or absolute (G) frequency of αβ-only, γδ-only, or bipotent αβ- and γδ-containing wells (left graphs) or frequency of TCR-αβ or TCR-γδ T cell–containing wells (right graphs) within single-plated CD34+CD4CD1a+ T-lineage committed thymocytes on the different OP9 cell lines, as indicated in the graph, that showed T cell reconstitution after 20 d of coculture. Data shows the mean of three independent experiments and error bars show SEM.
Figure 2.
Figure 2.
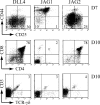
Jagged1 fails to support DP differentiation from mouse thymocytes. Flow cytometric data of murine c-kit+ fetal thymocytes after 7 or 10 d of coculture on OP9 stromal cells that express different Notch ligands (as indicated above dot plots). Early DN stages are distinguished by expression of CD44 and CD25 (top row) and T cell maturation is monitored by the coexpression of CD4 and CD8 (middle row). Development of TCR-γδ+CD3+ cells is shown in the bottom row. Results shown are representative of three independent experiments.
Figure 3.
Figure 3.
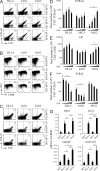
GSI rescues Jagged2-mediated inhibition of αβ-lineage differentiation. (A–C) Flow cytometric analysis of CD34+CD4CD1a+ progenitors cultured during 19 d on OP9 cells expressing the different Notch ligands (DLL4, JAG1, or JAG2), as indicated above the dot plots, in the presence of different concentrations of GSI, as indicated on the right of the dot plots. Effects of GSI are shown on TCR-αβ+CD3+ T cells (A), CD4+CD8β+ DP thymocytes (B), and TCR-γδ+CD3+ T cells (C). Numbers in the quadrants indicate the percentage of the corresponding populations and data are representative of three independent experiments. (D–F) Absolute number of TCR-αβ+CD3+ T cells (D), CD4+CD8β+ DP thymocytes (E), and TCR-γδ+CD3+ T cells (F) of cultures shown in A–C. Triangles below graphs indicate an increasing dosage of GSI, corresponding to 0 µM, 0.2 µM, 0.5 µM, and 1 µM GSI. Data shows the mean from three independent experiments (errors bars indicate SEM, * = P < 0.05). (G) Quantitative RT-PCR analysis of human CD34+ thymic precursors after 24 h of culture on equal amounts of DLL4-Fc–, JAG1-Fc–, or JAG2-Fc–coated plates. Units of expression are given relative to GAPDH. Data shows the mean of two sets of independent samples (errors bars indicate SEM, * = P < 0.05).
Figure 4.
Figure 4.
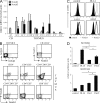
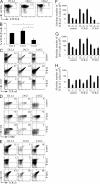
Notch3 is expressed in uncommitted human thymocytes and is efficiently bound and activated by Jagged2. (A) Quantitative RT-PCR analysis of Notch1 and Notch3 expression in freshly isolated human CB CD34+ cells and in different human thymocyte subsets. Units of expression are given relative to β-actin. Data shows the mean of two to eight sets of independent samples, and error bars indicate SEM. (B) Flow cytometric analysis of Notch1 and Notch3 receptor expression on freshly isolated CB or thymocytes. Density plots shown are representative of three independent experiments. Isotype staining was performed on total human thymocytes suspension. (C) Staining of control-Fc, Notch1-Fc, and Notch3-Fc fusion proteins to K562 cells expressing the different Notch ligands as indicated. Histograms shown are representative of three independent experiments. (D) Luciferase reporter assay of U2OS Tet-on flp-in-Notch1 and U2OS Tet-on flp-in-Notch3 cells cotransfected with CBF-luciferase reporter plasmid pGL2-Gal4-luciferase and the normalizing plasmid pRL-TK expressing Renilla luciferase. After plasmid transfection, cells were cocultured with K562 expressing DLL4, JAG1, JAG2, or control for 24 h, and thereafter luciferase activity was measured. Bar graphs show the mean of three independent experiments (error bars indicate SEM, * = P < 0.05).
Figure 5.
Figure 5.
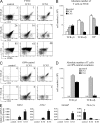
Constitutive active Notch3 promotes γδ T cell development more profoundly and induces a stronger Notch signal compared with Notch1. Control, ICN1, or ICN3 transduced CD34+CD4CD1a thymocytes were submitted to FTOC (A and B) or cultured on OP9 stromal cells that were not transduced with any Notch ligand (C and D). Numbers in dot plots indicate the percentage of cells for the corresponding populations after 4 wk of FTOC (A) or 3 wk of OP9 coculture (C). Dot plots shown are representative for three to four independent experiments. Graphs show the mean absolute numbers of TCR-γδ+, TCR-αβ+, or CD4+CD8β+ DP thymocytes generated after 3 wk of FTOC (B) or 3 wk of OP9 coculture (D). Data are derived from four independent experiments (error bars indicate SEM). (E) Quantitative gene expression analysis of Notch and T cell–related genes in human thymus CD34+ cells, sorted for eGFP expression 2 d after transduction with ICN1, ICN3, or control virus. The expression levels are normalized to β-actin levels. Data shown are the mean of two to three sets of independent samples and error bars show SEM.
Figure 6.
Figure 6.
Notch3 signaling is an important driver of human γδ T cell differentiation. (A) Flow cytometric analysis of CD34+CD4CD1a thymocytes after 4 wk of coculture on OP9 stromal cells that express the various Notch ligands and in the presence of control or blocking anti-Notch3 antibody, showing TCR-αβ and TCR-γδ staining of CD3+ gated thymocytes. Numbers in dot plots indicate the percentage of cells for the corresponding populations. (B) Absolute number of TCR-γδ T cells generated in cultures shown in A. (C) Absolute number of TCR-αβ T cells generated in cultures shown in A. Data are the mean from five independent experiments (errors bars indicate SEM, * = P < 0.05). (D) Flow cytometric analysis of CD34+CD4CD1a thymocytes, transduced with control or full-length Notch1 (FLN1) or full-length Notch3 (FLN3), and cocultured for 3 wk on OP9 cells expressing the different Notch ligands (DLL4, Jagged1, or Jagged2) as indicated. Numbers in dot plots show the frequency of TCR-γδ T cells. Data are representative of three independent experiments. (E) Absolute number of TCR-γδ T cells generated from cultures shown in D. Data are derived from three independent experiments (errors bars indicate SEM, * = P < 0.05).
Figure 7.
Figure 7.
Jagged2/Notch3 signaling is critical for human γδ-lineage differentiation. (A) Flow cytometric analysis of Jagged2 expression in TECs from Jag2lox/loxFoxn1-Cre−/− (black histogram), Jag2lox/wtFoxn1-Cre+/− (white histogram), and Jag2lox/loxFoxn1-Cre+/− (gray histogram) fetal thymic lobes. Data are representative of three independent experiments. (B) Absolute number of human γδ T cells in FTOCs with Jag2lox/loxFoxn1-Cre−/− (black bar) and Jag2lox/loxFoxn1-Cre+/− (gray bar) fetal thymic lobes. Data shows the mean of seven independent experiments and error bars indicate the SEM (* = P < 0.05). (C) Mean frequency of human γδ T cells in FTOCs with Jag2lox/loxFoxn1-Cre−/− (black bar) and Jag2lox/loxFoxn1-Cre+/− (gray bar) fetal thymic lobes. Data show the mean of seven independent experiments and error bars indicate the SEM (* = P < 0.05). (D) Flow cytometric analysis of human T cell development in FTOCs with Jag2lox/loxFoxn1-Cre−/− and Jag2lox/loxFoxn1-Cre+/− fetal thymic lobes. Dot plots show CD3 versus TCR-αβ expression and histograms shown TCR-γδ expression in CD3+TCR-αβ+ (white histogram) versus CD3+TCR-αβ (black histogram) cells, gated from human CD45+ cells. Frequencies in dot plots show the frequency of γδ-lineage (CD3+TCR-αβTCR-γδ+) T cells. (E) Histograms show Vδ1, Vδ2, Vδ3, and Vγ9 staining from TCR-γδ gated cells shown in D. Numbers indicate the frequency of positive cells for the corresponding antigen. Data are representative of three independent experiments. (F) Absolute number of human γδ T cells in FTOCs with control (black bar) and blocking Notch3 antibodies (gray bar). Data shows the mean of three independent experiments and error bars indicate the SEM. (G) Mean frequency of human γδ T cells in FTOCs with control (black bar) and blocking Notch3 antibodies (gray bar). (H) Flow cytometric analysis of human T cell development in FTOCs with control or blocking Notch3 antibodies. Dot plots show CD3 versus TCR-αβ expression and histograms shown TCR-γδ expression in CD3+TCR-αβ+ (white histogram) versus CD3+TCR-αβ (black histogram) cells, gated from human CD45+ cells. Frequencies in dot plots show the frequency of γδ-lineage (CD3+TCR-αβTCR-γδ+) T cells. Data are representative for three independent experiments.
Figure 8.
Figure 8.
Jagged2-mediated inhibition of TCR-β chain expression represses αβ-lineage differentiation. (A) Flow cytometric analysis of intracellular CD3ε and TCR-β expression in CD34+CD4CD1a thymic progenitors after 3 wk of coculture on OP9 stromal cells expressing the different Notch ligands. Data are representative of three independent experiments. (B) The mean frequency of icTCR-β+ cells generated from CD34+CD4CD1a thymic progenitors on the various OP9 stromal cells. Data are derived from three independent experiments (error bars indicate SEM, * = P < 0.05). (C–E) Flow cytometric analysis of human CD34+CD4CD1a thymic progenitors transduced with control, TCR-β, or TCR-δ after coculture on OP9 stromal cells expressing the different human Notch ligands, as indicated above the dot plots. Numbers in top right quadrants indicate the percentage of TCR-αβ+CD3+ cells (C), CD4+CD8β+ DP cells (D), or TCR-γδ+CD3+ cells (E). (F–H) Bar diagrams show the absolute numbers of TCR-αβ+CD3+ cells (F), CD4+CD8β+ DP cells (G), or TCR-αβ+CD3+ cells (H) obtained after OP9 coculture with the different Notch ligands. Error bars represent means and SEM of three independent experiments (D4 = DLL4, J1 = JAG1, and J2 = JAG2).

Similar articles

Cited by

References

    1. Archbold J.K. 2009. To be gammadelta or not to be gammadelta? Signaling pathways in alphabeta versus gammadelta T cell maturation. Sci. Signal. 2:jc2 10.1126/scisignal.2100jc2 - DOI - PubMed
    1. Artavanis-Tsakonas S., Rand M.D., Lake R.J. 1999. Notch signaling: cell fate control and signal integration in development. Science. 284:770–776 10.1126/science.284.5415.770 - DOI - PubMed
    1. Beatus P., Lundkvist J., Oberg C., Lendahl U. 1999. The notch 3 intracellular domain represses notch 1-mediated activation through Hairy/Enhancer of split (HES) promoters. Development. 126:3925–3935 - PubMed
    1. Benedito R., Roca C., Sörensen I., Adams S., Gossler A., Fruttiger M., Adams R.H. 2009. The notch ligands Dll4 and Jagged1 have opposing effects on angiogenesis. Cell. 137:1124–1135 10.1016/j.cell.2009.03.025 - DOI - PubMed
    1. Blom B., Spits H. 2006. Development of human lymphoid cells. Annu. Rev. Immunol. 24:287–320 10.1146/annurev.immunol.24.021605.090612 - DOI - PubMed

Publication types

MeSH terms