. 2013 Jan 17;152(1-2):262-75.
doi: 10.1016/j.cell.2012.11.052.

Derepression of a neuronal inhibitor due to miRNA dysregulation in a schizophrenia-related microdeletion

Affiliations

Derepression of a neuronal inhibitor due to miRNA dysregulation in a schizophrenia-related microdeletion

Bin Xu et al. Cell. .

Abstract

22q11.2 microdeletions result in specific cognitive deficits and schizophrenia. Analysis of Df(16)A(+/-) mice, which model this microdeletion, revealed abnormalities in the formation of neuronal dendrites and spines, as well as altered brain microRNAs. Here, we show a drastic reduction of miR-185, which resides within the 22q11.2 locus, to levels more than expected by a hemizygous deletion, and we demonstrate that this reduction alters dendritic and spine development. miR-185 represses, through an evolutionarily conserved target site, a previously unknown inhibitor of these processes that resides in the Golgi apparatus and shows higher prenatal brain expression. Sustained derepression of this inhibitor after birth represents the most robust transcriptional disturbance in the brains of Df(16)A(+/-) mice and results in structural alterations in the hippocampus. Reduction of miR-185 also has milder age- and region-specific effects on the expression of some Golgi-related genes. Our findings illuminate the contribution of microRNAs in psychiatric disorders and cognitive dysfunction.


Figures

Figure 1
Figure 1. Drastic reduction of mir-185 expression in Df(16)A+/− mice
(A) Schematic diagram showing the 1.5-Mb 22q11.2 critical region and the syntenic mouse locus. The 1.5-Mb deletion is mediated by low copy repeat sequences LCR-A and LCR-B (illustrated as black boxes). Dgcr8 and miR-185 (hosted in the intron of the 22orf25 gene in human and the D16H22S680E gene in mouse) are highlighted in red. (B) Expression of miR-185 mRNA in HPC and cortex as shown by in situ hybridization in coronal brain sections using an antisense miR-185 probe. An antisense U6 probe and a scramble probe were used as positive and negative controls, respectively. Images were taken at either 4X (left panels) or 10X (right panels) magnification. (C–E) miR-185 expression levels in HPC (C) or PFC (D) of Df(16)A+/− (n = 7 for mutant, n = 9 for Wt) and in HPC (E) of Dgcr8+/− (n = 10 for mutant and Wt), as assayed by qRT-PCR. Expression levels in mutant mice were normalized to their respective Wt littermates. Results are expressed as mean ± SEM. *P < 0.05, **P < 0.01, ***P < 0.001 (Student’s t- test). See also Figure S1.
Figure 2
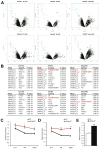
Figure 2. 2310044H10Rik (Mirta22) is robustly upregulated in the brain of Df(16)A+/− mice
(A) Changes in gene expression in the PFC (upper panel) or HPC (lower panel) of Df(16)A+/− and Wt littermate control mice at E16, P6 and adulthood (n = 10 each group): Volcano plot of the P-values and the corresponding relative expression of each gene. Light blue dots indicate genes within Df(16)A deficiency; light green dots indicate upregulated miRNA-containing transcripts; red dots indicate probe sets representing Mirta22. (B) Top 10 protein encoding genes that show significant upregulation in the PFC (upper panel) or HPC (lower panel) of Df(16)A+/− and Wt littermate mice at E16, P6 and adulthood. Mirta22 is highlighted in red. (C, D) Temporal expression of 2310044H10Rik (Mirta22) in the PFC (C) and HPC (D) of Df(16)A+/− and Wt littermate mice as monitored by qRT-PCR. n = 9–10 for each group. (E) Increased expression of endogenous 2310044H10Rik (Mirta22) in DIV9 hippocampal neurons isolated from Df(16)A+/− animals as assayed by qRT-PCR (n = 3 each genotype). Expression levels in mutant neurons were normalized to Wt neurons. Results are expressed as mean ± SEM. *P < 0.05, **P < 0.01, ***P < 0.001 (Student’s t- test). See also Figure S2, Tables S1 and S2.
Figure 3
Figure 3. miR-185 directly targets and represses 2310044H10Rik (Mirta22)
(A) Structure of the 3′UTR of 2310044H10Rik (Mirta22) showing miRNA binding sites predicted by TargetScan or mirDB. Blocks in mouse 2310044H10Rik (Mirta22) 3′UTR that are highly conserved in rat and human orthologues are shown below the mouse 3′UTR. Evolutionary conservation is also assessed by the “30-way multiz alignment and conservation analysis” in the USCS browser, with conserved blocks indicated by green peaks. miR-185 and miR-485 binding sites located within the conserved blocks are shown in red. (B, C) qRT-PCR quantification of endogenous 2310044H10Rik (Mirta22) in DIV7 hippocampal neurons. Expression levels in anti-miR-185-treated and pre-mir-185-treated neurons were normalized to expression levels under respective controls. (B) Increased expression levels of Mirta22 in neurons transfected with anti-miR-185 at DIV5 (n = 5, each treatment). (C) Reduced expression levels of Mirta22 in DIV9 hippocampal neurons transfected with pre-mir-185 mimic at DIV7 (n = 3, each treatment). (D, E) qRT-PCR quantification of endogenous 2310044H10Rik (Mirta22) in N18 cells. Expression levels in pre-mir-185-treated and anti-miR-185-treated cells were normalized to expression levels under respective controls. (D) Reduced expression levels of Mirta22 in cells transfected with pre-mir-185 mimic (n = 3, each treatment). (E) Up-regulation of Mirta22 in cells transfected with an anti-miR-185 LNA oligo (n = 3, each treatment). (F–H) Repression effects of pre-mir-185, pre-mir-485 and pre-mir-491 on Mirta22 3′UTR were examined by a dual-luciferase reporter assay (see Methods). Values are Renilla luciferase levels relative to firefly luciferase levels and normalized to the relative expression levels under pre-scramble treatment (F, H) or to the relative expression levels from plasmid with no 3′UTR (G) (n = 3 for each condition). Pre-mir-185 significantly decreases the 2310044H10Rik (Mirta22) 3′UTR reporter expression over a concentration range of 10nM to 0.01nM (F). Pre-mir-185 mediated repression on 2310044H10Rik (Mirta22) 3′UTR reporter expression depends on conserved miRNA binding sites (G). Pre-mir-485 and pre-mir-491 significantly decreases the 2310044H10Rik (Mirta22) 3′UTR reporter expression (H). Results are expressed as mean ± SEM. *P < 0.05, **P < 0.01, ***P < 0.001 (Student’s t- test). See also Figure S3 and Table S3.
Figure 4
Figure 4. Genomic structure, neuronal expression and subcellular localization of 2310044H10Rik (Mirta22)
(A) Top: Structure of mRNA transcripts of 2310044H10Rik (Mirta22) and its human orthologue, C19orf63. RefSeq reports a 2310044H10Rik (Mirta22) transcript with 7 exons (blue rectangles), which is predicted to encode a signal peptide and a transmembrane domain (red rectangles). The peptide epitope used to generate a polyclonal antibody is marked by green rectangle. For C19orf63, RefSeq reports 2 alternatively spliced transcripts: one that encodes a predicted transmembrane protein and one with an additional exon that encodes a predicted secreted protein. Bottom: Protein sequence alignment of predicted transmembrane isoforms encoded by 2310044H10Rik (Mirta22) and its human orthologue. Black blocks indicate completely conserved residues; grey blocks indicate similar residues (defined by Boxshade default similarities); white blocks indicate different residues. (B) Upper: Representative western blot assays of 2310044H10Rik (Mirta22) in PFC lysates prepared from Df(16)A+/− animals and Wt littermates. Alpha-tubulin is used as loading control. Lower: Quantification of 2310044H10Rik (Mirta22) protein level in PFC of Df(16)A+/− and Wt animals (n = 9 each genotype). Expression levels in mutant mice were normalized to Wt littermates. Results are expressed as mean ± SEM. **P < 0.01 (Student’s t- test). (C) Quantification of 2310044H10Rik (Mirta22) immunocytochemical signals in Df(16)A+/− and Wt cultured neurons (n = 31 for Df(16)A+/−; n = 34 for Wt). Expression levels in mutant neurons were normalized to Wt neurons. Results are expressed as mean ± SEM. *P < 0.05 (Student’s t-test). (D) Upper panel: 2310044H10Rik (Mirta22) co-localizes with neuron specific marker NeuN, but not with glia specific marker GFAP, in cultured hippocampal neurons at DIV20. Middle panel: 2310044H10Rik (Mirta22) (green) co-localizes with Golgi specific marker GM130 (red) in the soma. 2310044H10Rik (Mirta22) is also found in vesicles and tubular-like clusters in the dendrites, which are highlighted by the dendritic marker MAP2 (blue). Lower panel: Distribution of 2310044H10Rik (Mirta22) protein in adult mouse brain. Sections were stained with 2310044H10Rik (Mirta22) antibody. Images were taken at 4X, 10X, 20X and 40X magnifications as indicated. Red boxes in 4X, 10X, 20X images outline the area shown in 10X, 20X and 40X images, respectively. See also Figure S4.
Figure 5
Figure 5. Coordinated mild dysregulation of Golgi-related putative miR-185 targets in Df(16)A+/− mice
(A) DAVID functional annotation clustering analysis (left) and Gene Set Enrichment Analysis (GSEA v2.0) (right) of genes predicted as miR-185 targets by TargetScan Mouse v5.2 identified Gene Ontology (GO) terms “Golgi apparatus” and “Golgi apparatus part” as the top enriched gene sets (see Supplemental Methods). (B) Expression heatmap plot of the potential miR-185 targets that serve Golgi apparatus related functions (GO term) and are differentially expressed (P < 0.005) between adult HPC of Df(16)A+/− mice and Wt littermates. ID is Affymetrix ID (see Table S4); Rank is the ranking position in the list of all differentially expressed genes according to significance level. Note that the majority (89%, 34 out of 38) of the genes are upregulated. See also Figure S5 and Table S4.
Figure 6
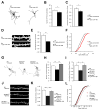
Figure 6. Reduced miR-185 levels contribute to structural alterations of Df(16)A+/− neurons
(A) Representative images of Wt neurons at DIV9 transfected with anti-miR control or anti-miR-185 oligos and enhanced GFP. (B, C) Reduction in the number of primary dendrites (B) and branch points (C) in Wt neurons at DIV9, 2 days after transfection with anti-miR-185 relative to Wt neurons transfected with anti-miR control (n = 21 for Wt + anti-miR-185; n = 20 for Wt + anti-miR control). In (C), values of Wt + anti-miR-185 were normalized to Wt + anti-miR control. (D) Representative images of spines on Wt neurons at DIV19, transfected with anti-miR control or anti-miR-185, as well as enhanced GFP. (E) Reduction in the density of mushroom spines in neurons transfected with anti-miR-185 relative to neurons transfected with anti-miR control (n = 20 for Wt + anti-miR-185; n = 20 for Wt + anti-miR control). Values of Wt + anti-miR-185 were normalized to Wt + anti-miR control. (F) Transfection of anti-miR-185 oligos significantly decreased the width of mushroom spines compared to that of the neurons transfected with anti-miR control at DIV19 (15%, P < 0.001, Kolmogorov-Smirnov test) (n = 232 for Wt + anti-miR-185; n = 293 for Wt + anti-miR control). (G) Representative Df(16)A+/− neurons at DIV9 transfected with pre-scramble or pre-mir-185 mimic and enhanced GFP for visualization. Scale Bar, 20 μm. (H, I) Reduction in the number of primary dendrites (H) and branch points (I) in Df(16)A+/− neurons at DIV9 relative to Wt neurons is reversed by the transfection of pre-mir-185, but not pre-scramble mimic (pre-scr) (n = 21 for Wt + pre-scr; n = 21 for Df(16)A+/− + pre-scr; n = 21 for Df(16)A+/−+ pre-mir-185). In (I), values of Df(16)A+/− neurons were normalized to Wt + pre-scr. (J) Representative images of spines on Df(16)A+/− neurons at DIV19, transfected with pre-scramble or pre-mir-185 mimic, as well as enhanced GFP. Scale Bar, 5 μm. (K) Reduction in the density of mushroom spines in DIV19 Df(16)A+/− neurons relative to Wt control neurons is reversed by the transfection of pre-mir-185, but not pre-scramble mimic, into Df(16)A+/− neurons. (n = 23 for Wt + pre-scr; n = 21 for Df(16)A+/− + pre-scr; n = 23 for Df(16)A+/− + pre-mir-185). Values of Df(16)A+/− neurons were normalized to Wt + pre-scr. (L) Transfection of pre-mir-185 mimic, but not pre-scramble control, significantly increased the width of mushroom spines of Df(16)A+/− neurons at DIV19 (18%, P < 0.001, Kolmogorov-Smirnov test) (n = 568 for Wt + pre-scr; n = 339 for Df(16)A+/− + pre-scr; n = 527 for Df(16)A+/− + pre-mir-185). (B, C, E, H, I, K) Results are expressed as mean ± SEM. *P < 0.05, **P < 0.01 (Student’s t-test). See also Figure S6.
Figure 7
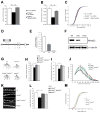
Figure 7. Reduction of Mirta22 levels reverses structural alterations in the HPC of Df(16)A+/− mice in vitro and in vivo
(A) Reduction in the number of primary dendrites in Df(16)A+/− neurons at DIV9 relative to Wt neurons is reversed by the transfection of a construct that expresses 2310044H10Rik (Mirta22) shRNA+/− (n = 24 for Wt + scr shRNA; n = 21 for Df(16)A+/− + scr shRNA; n = 25 for Df(16)A+/− +Mirta22 shRNA). Scr shRNA: scramble shRNA. (B) Reduction in the density of mushroom spines in Df(16)A+/− neurons at DIV19 relative to Wt neurons is reversed by the introduction of Mirta22 shRNA, but not scramble shRNA (n = 22 for Wt + scr shRNA; n = 24 for Df(16)A+/− + scr shRNA; n = 15 for Df(16)A+/− + Mirta22 shRNA). Values of Df(16)A+/− neurons were normalized to Wt + scr shRNA. (C) Transfection of Mirta22 shRNA does not affect the width of mushroom spines of Df(16)A+/− neurons at DIV19 (P > 0.05, Kolmogorov-Smirnov test). n = 342 for Wt + pre-scr; n = 289 for Df(16)A+/− + pre-scr; n = 177 for Df(16)A+/− + pre-mir-185. (D) Schematic (not to scale) of the genomic structure of Mirta22 depicting the gene-trap insertion in the intron between exons 1 and 2. Red arrowheads indicate approximate genomic location of PCR primers used for qRT-PCR. (E) Mirta22 transcript levels in HPC of adult homozygous (n = 3) and heterozygous (n = 3) Mirta22 mutant mice as well as their Wt littermates (n = 3), as assayed by qRT-PCR. (F) Representative Western blot assay depicting Mirta22 protein levels in HPC of adult homozygous (n = 3) and heterozygous (n = 3) Mirta22 mutant mice as well as their Wt littermates. Levels of α-tubulin are shown as internal loading controls. (G) Representative images from diolistic labeling of basal dendrites of CA1 pyramidal neurons from all four tested genotypes. Brains were dissected from 8-wk old littermate mice. (H, I) Number of primary dendrites (H) and branch points (I) in the basal dendritic tree of CA1 pyramidal neurons from all four tested genotypes (n = 17 for Wt; n = 29 for Df(16)A+/−; n = 23 for Df(16)A+/−;Mirta22+/−; n = 22 for Mirta22+/−). In (I), values of Df(16)A+/− and Df(16)A+/−;Mirta22+/− neurons were normalized to Wt neurons. (J) Sholl analysis of basal dendrite complexity of CA1 pyramidal neurons using 10 μm concentric circles around the soma. n = 17 for Wt; n = 29 for Df(16)A+/−; n = 23 for Df(16)A+/−;Mirta22+/−; n = 22 for Mirta22+/−. Note that the reduction in branching in Df(16)A+/− CA1 neurons is more prominent at the 50–100 μm range from soma as compared to Wt neurons (black asterisks for Wt versus Df(16)A+/− comparison) and it is reversed in the presence of the Mirta22 mutation (blue asterisks for Df(16)A+/− versus Df(16)A+/−;Mirta22+/− comparison). (K) Representative images of spines at the basal dendrites of CA1 pyramidal neurons from all four tested genotypes. Brains were dissected from 8-wk old littermate mice. (L) Density of total spines in the basal dendritic tree of CA1 pyramidal neurons from all four tested genotypes. Note that reduction in spine density in Df(16)A+/− CA1 neurons is reversed in the compound heterozygous Df(16)A+/−;Mirta22+/− mice. (n = 14 for Wt; n = 6 for Df(16)A+/−; n = 9 for Df(16)A+/−;Mirta22+/−; n = 9 for Mirta22+/−). (M) Width of mushroom spines (quantified over 60 μm of dendritic length) in the basal dendritic tree of CA1 pyramidal neurons from all four tested genotypes. Note that reduction in width is reversed in the compound heterozygous mice Df(16)A+/−;Mirta22+/− (P < 0.001, Kolmogorov-Smirnov test). Results are expressed as mean ± SEM. *P < 0.05, **P < 0.01, ***P < 0.001 (Student’s t- test). See also Figure S7.

Similar articles

Cited by

References

    1. Ambros V. MicroRNAs: genetically sensitized worms reveal new secrets. Curr Biol. 2010;20:R598–600. - PubMed
    1. Arguello PA, Gogos JA. Modeling madness in mice: one piece at a time. Nuron. 2006;52:179–196. - PubMed
    1. Arguello PA, Gogos JA. Cognition in mouse models of schizophrenia susceptibility genes. Schizophr Bull. 2010;36:289–300. - PMC - PubMed
    1. Arguello PA, Gogos JA. Genetic and cognitive windows into circuit mechanisms of psychiatric disease. Trends Neurosci. 2012;35:3–13. - PubMed
    1. Baek D, Villen J, Shin C, Camargo FD, Gygi SP, Bartel DP. The impact of microRNAs on protein output. Nature. 2008;455:64–71. - PMC - PubMed

Publication types

MeSH terms

Supplementary concepts

Associated data