. 2012 Oct 12;151(2):400-13.
doi: 10.1016/j.cell.2012.09.010.

Mechanism of fatty-acid-dependent UCP1 uncoupling in brown fat mitochondria

Affiliations

Mechanism of fatty-acid-dependent UCP1 uncoupling in brown fat mitochondria

Andriy Fedorenko et al. Cell. .

Abstract

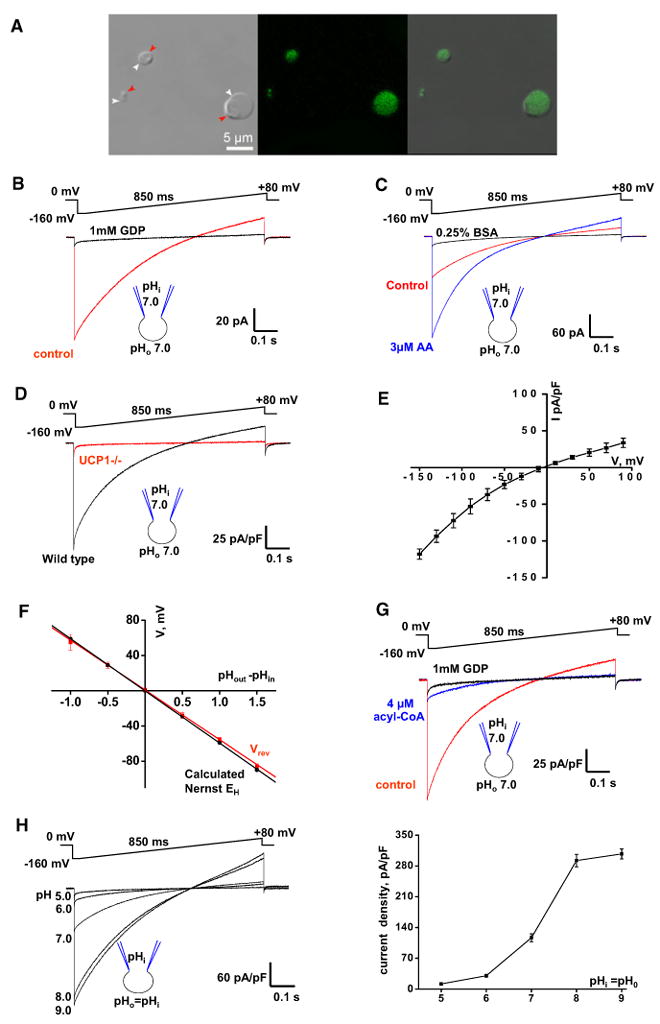
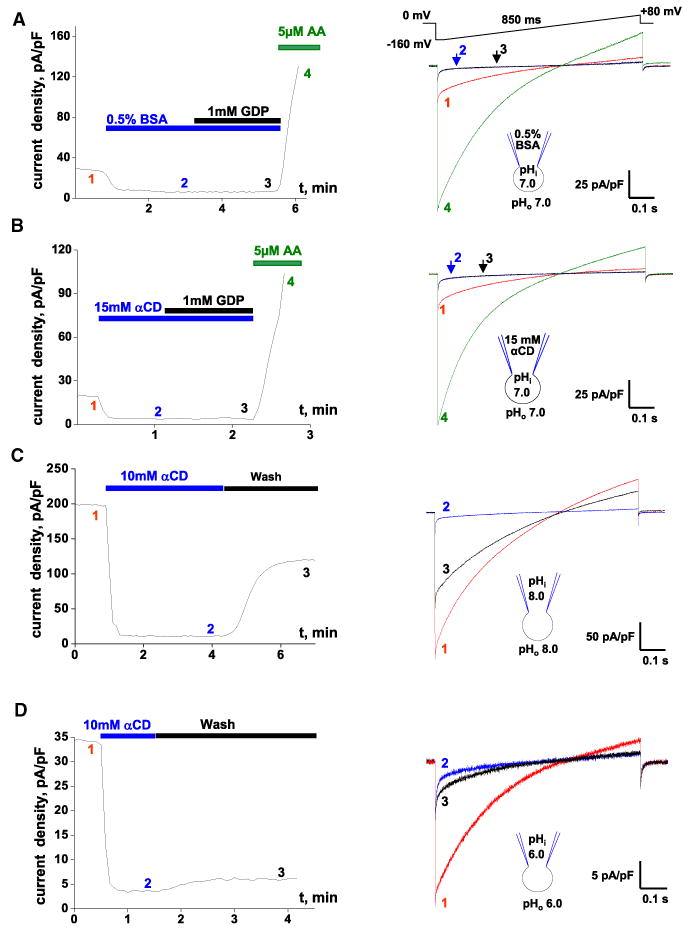
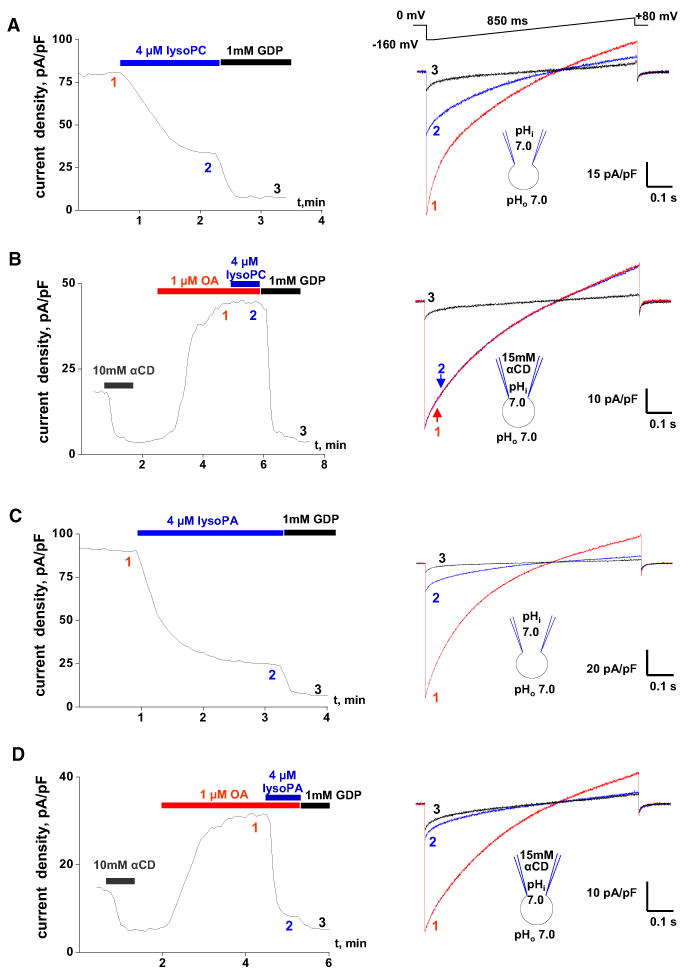
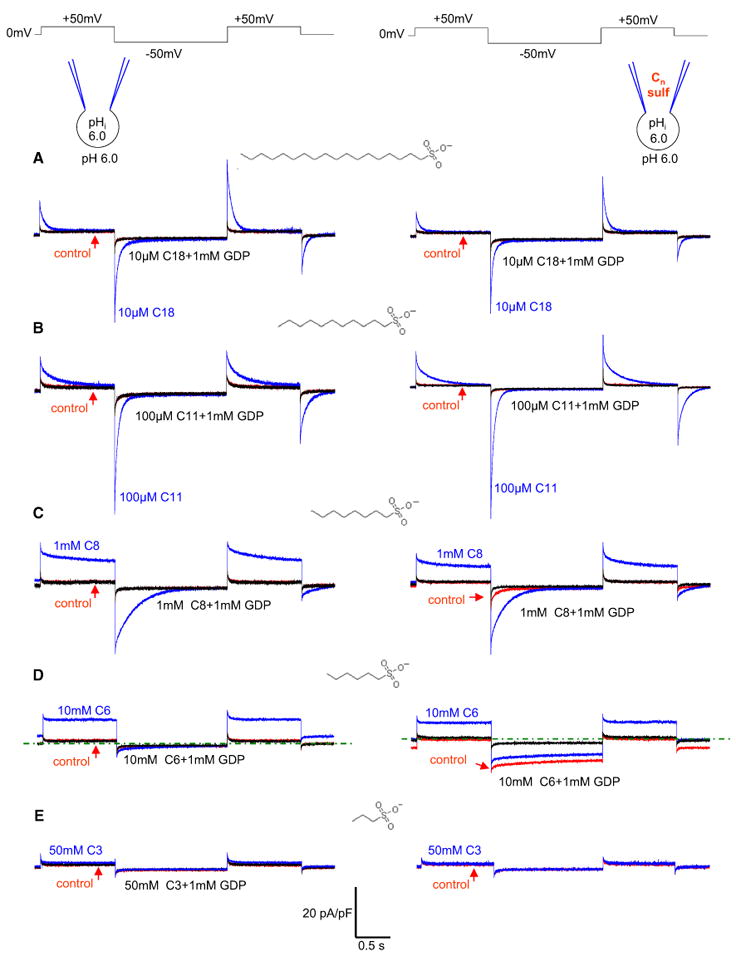
Mitochondrial uncoupling protein 1 (UCP1) is responsible for nonshivering thermogenesis in brown adipose tissue (BAT). Upon activation by long-chain fatty acids (LCFAs), UCP1 increases the conductance of the inner mitochondrial membrane (IMM) to make BAT mitochondria generate heat rather than ATP. Despite being a member of the family of mitochondrial anion carriers (SLC25), UCP1 is believed to transport H(+) by an unusual mechanism that has long remained unresolved. Here, we achieved direct patch-clamp measurements of UCP1 currents from the IMM of BAT mitochondria. We show that UCP1 is an LCFA anion/H(+) symporter. However, the LCFA anions cannot dissociate from UCP1 due to hydrophobic interactions established by their hydrophobic tails, and UCP1 effectively operates as an H(+) carrier activated by LCFA. A similar LCFA-dependent mechanism of transmembrane H(+) transport may be employed by other SLC25 members and be responsible for mitochondrial uncoupling and regulation of metabolic efficiency in various tissues.


Figures

Figure 1
Figure 1. Electrophysiological Properties of UCP1 Current
(A) Transmitted, fluorescent, and superimposed images (left to right) of BAT mitoplasts isolated from mice expressing CFP in the mitochondrial matrix (false green color). White arrows, IMM; red arrows, remnants of outer membrane. (B) Whole-mitoplast putative UCP1 current before (control, red) and after (black) the addition of 1 mM GDP to the bath solution. The voltage protocol is indicated at the top. The pipette-mitoplast diagram indicates the recording conditions. The mitoplast membrane capacitance was 1.1 pF. (C) Putative UCP1 current (control, red) is potentiated by 3 μM arachidonic acid (AA, blue) and inhibited by 0.25% BSA (black). The mitoplast membrane capacitance was 1.0 pF. (D) Representative whole-mitoplast currents recorded from wild-type (black) and UCP1–/– (red) mitoplasts. (E) Current-voltage dependence of IUCP1. Amplitudes were measured at the beginning of the voltage steps shown in Figure S1D; n = 5. (F) IUCP1 reversal potentials (Vrev) compared to H+ equilibrium potentials (EH) predicted by the Nernst equation. The red line indicates the linear fitting of IUCP1 reversal potentials versus ΔpH; n = 3–10. The black line indicates EH calculated by the Nernst equation at 24°C. (G) Whole-mitoplast IUCP1 before (control, red), after the addition of 4 μM oleoyl-CoA to the bath solution (blue), and after the subsequent application of 1 mM GDP (black). (H) Left panel: IUCP1 at different symmetrical pH values. Representative traces recorded from different mitoplasts are shown. Right panel: Mean IUCP1 densities in different symmetrical pH values; n = 4–12. Amplitudes were measured upon stepping from 0 to [C0]160 mV as in the left panel. Error bars represent standard error of the mean (SEM). See also Figure S1.
Figure 2
Figure 2. UCP1 Is Activated by Endogenous Membrane LCFAs
(A) Left panel: Representative time course of IUCP1 amplitude in control (1), upon application of 0.5% BSA (2), and with 0.5% BSA and 1 mM GDP (3). AA (5 μM) was applied at the end to verify that IUCP1 can still be activated (4). Pipette solution contained 0.5% BSA. Amplitudes were measured upon stepping from 0 to –160 mV (see right panel). Right panel: IUCP1 traces recorded at times 1, 2, 3, and 4 as indicated in the left panel. (B) The same experiment as in (A) but performed with 15 mM αCD in the bath and pipette solutions. (C) Left panel: Representative time course of IUCP1 amplitude in control (1) and upon the application (2) and subsequent washout (3) of 10 mM αCD at pH 8.0. Right panel: IUCP1 traces recorded at times 1, 2, and 3 as indicated in the left panel. (D) The same experiment as in (C) but performed at symmetrical pH 6.0. See also Figure S2.
Figure 3
Figure 3. Regulation of IUCP1 by Lysophospolipids
(A) Left panel: Representative time course of the IUCP1 amplitude in control (1), upon the application of 4 mM oleoyl-lysoPC (2), and the subsequent application of 1 mM GDP (3). IUCP1 amplitudes were measured upon stepping from 0 to [C0]160 mV (see right panel). Right panel: IUCP1 traces recorded at times 1, 2, and 3 as indicated in the left panel. (B) Left panel: Representative time course of the IUCP1 amplitude after the extraction of endogenous LCFAs with 10 mM aCD, reactivation of IUCP1 with 1 mM OA (1), the subsequent addition of 4 mM oleoyl-lysoPC (2), and the application of 1 mM GDP (3). The pipette solution contained 15 mM aCD to extract endogenous membrane LCFAs. Right panel: IUCP1 traces recorded at times 1, 2, and 3 as indicated in the left panel. (C) The same experiment as in (A) but performed with 4 mM oleoyl-lysoPA instead of oleoyl-lysoPC. (D) The same experiment as in (B) but performed with 4 mM oleoyl-lysoPA instead of oleoyl-lysoPC. See also Figure S3.
Figure 4
Figure 4. Alkylsulfonates Are UCP1 Transport Substrates
Left panels: Representative IUCP1 recorded after the extraction of endogenous membrane LCFAs with αCD (control, red), after subsequent application of the indicated concentration of Cn-sulfonate (blue), and upon adding 1 mM GDP (black) at symmetrical pH 6.0. The structure of the activating Cn-sulfonate is shown near the currents induced. Right panels: Same as the left panels, except that the pipette solution contained the same concentration of Cn-sulfonate as applied to the bath (10 μM C18 in A, 100 μM C11 in B, 1 mM C8 in C, 10 mM C6 in D, and 50 mM C3 in E). The calibration bar relates to all traces. A zero current level is indicated by the green dotted line in (C) and (D). See also Figure S4.
Figure 5
Figure 5. H+ Transport by UCP1 Is Coupled to Transport of LCFA Anions
(A) Comparison of reversal potentials (Vrev) of the IUCP1 induced by C6-sulfonate, with C6-sulfonate equilibrium potentials (EC6) predicted by the Nernst equation. The red line indicates the linear fitting of IUCP1 reversal potentials; Vrev versus –log [C6]o/[C6]i, n = 3–6. The black line indicates EC6 calculated by the Nernst equation at 24°C. (B) Upper panel: The IUCP1 activated by endogenous membrane LCFAs before (control, red) and after the application of 50 μM C11-sulfonate either alone (blue) or in combination with 1 mM GDP (black). Lower panel: The same experiment as in the upper panel but with 5 μM C18-sulfonate. (C) IUCP1 in 10 mM αCD (control, red) and in 10 mM αCD plus 3.5 mM DBLA (blue) at symmetrical pH 6.0 (upper panel), pH 7.0 (middle panel), and pH 8.0 (lower panel). Error bars represent SEM. See also Figure S5.
Figure 6
Figure 6. Asymmetry of LCFA Binding to UCP1
(A) IUCP1 recorded with 2 mM C11-sulfonate in the pipette. Representative IUCP1 recorded upon extraction of endogenous membrane LCFAs with αCD (control, red), in 100 μM C11-sulfonate (blue), and after the addition of 1 mM GDP (black). (B) Upper panel: IUCP1 recorded with 10 mM αCD in the pipette. Representative IUCP1 recorded upon extraction of endogenous membrane LCFAs with αCD (control, red), in 100 μM C11-sulfonate (blue), and after the addition of 1 mM GDP (black). Lower panel: IUCP1 recorded with 2 mM C11-sulfonate in the pipette. Representative IUCP1 recorded upon extraction of endogenous membrane LCFAs with αCD (control, red), in 10 mM αCD (blue), and after the addition of 1 mM GDP (black). (C) Amplitudes of the inward (negative) and outward (positive) UCP1 currents induced by various alkylsulfonates added to the bath (blue) or pipette (red) solutions. IUCP1 was recorded with the same alkylsulfonate concentrations using the same voltage protocol as in Figures 4A–4D. IUCP1 was measured in the beginning of the second (–50 mV, inward IUCP1) and third (+50 mV, outward IUCP1) voltage steps. The leak current remaining after application of 1 mM GDP was subtracted. (D) IUCP1 recorded with 50 mM C6-sulfonate (upper panel) and 10 mM αCD (lower panel) in the pipette solution. Representative IUCP1 in 10 mM αCD (red), in 50 mM C6-sulfonate (blue), and after the addition of 1 mM GDP (black). The zero current level is indicated by the dotted line. (E) I/V curves of IUCP1 induced by1 mM OA at pH 7.0 (black) and pH 8.0 (red). The pipette solution contained 15 mM αCD, pH 7.0. The IUCP1 amplitudes were measured as indicated in Figure S6B. (F) The dose dependence of IUCP1 inhibition by ATP at two different concentrations of activating OA.IUCP1 was activated either with 0.2 mM OA mixed with 10 mM MβCD (red curve) or with 2 mM OA mixed with 10 mM MβCD (black curve). Amplitudes were measured upon stepping from 0 to –160 mV as in Figures S6C and S6D. Error bars represent SEM. See also Figure S6.
Figure 7
Figure 7. LCFA-Shuttling Model of UCP1 Operation
(A) The simplest mechanism of steady H+IUCP1 induced by LCFAs. UCP1 operates as a symporter that transports one LCFA and one H+ per the transport cycle. First, the LCFA anion binds to UCP1 on the cytosolic side at the bottom of a hypothetical cavity (1). H+ binding to UCP1 occurs only after the LCFA anion binds to UCP1(1). The H+ and the LCFA are translocated by UCP1 upon conformational change, and H+ is released on the opposite side of the IMM, whereas the LCFA anion stays associated with UCP1 due to the hydrophobic interactions established by its carbon tail (2). The LCFA anion then returns to initiate another H+ translocation cycle (3). Charge is translocated only in step 3 when the LCFA anion returns without the H+. (B) The mechanism of transient IUCP1 induced by low-pKa LCFA analogs. A low-pKa LCFA analog can be translocated by UCP1 similar to an LCFA anion. However, the low pKa of the LCFA analog prevents the binding of H+ to UCP1. The negatively charged low-pKa LCFA analog shuttles within the UCP1 translocation pathway in response to the transmembrane voltage, producing transient currents. (C) The mechanism of steady IUCP1 induced by short-chain low-pKa fatty-acid analogs. The hydrophobic tail is too short to anchor the fatty analog to UCP1, and the analog is translocated through UCP1, producing a steady current. In contrast to LCFAs, the short-chain low-pKa fatty-acid analogs can bind to UCP1 on both sides of the IMM.

Similar articles

Cited by

References

    1. Anel A, Richieri GV, Kleinfeld AM. Membrane partition of fatty acids and inhibition of T cell function. Biochemistry. 1993;32:530–536. - PubMed
    1. Annunziata O, Costantino L, D’Errico G, Paduano L, Vitagliano VV. Transport Properties for Aqueous Sodium Sulfonate Surfactants. J Colloid Interface Sci. 1999;216:16–24. - PubMed
    1. Aquila H, Link TA, Klingenberg M. The uncoupling protein from brown fat mitochondria is related to the mitochondrial ADP/ATP carrier. Analysis of sequence homologies and of folding of the protein in the membrane. EMBO J. 1985;4:2369–2376. - PMC - PubMed
    1. Bezanilla F. The voltage sensor in voltage-dependent ion channels. Physiol Rev. 2000;80:555–592. - PubMed
    1. Bhamidipati SP, Hamilton JA. Interactions of lyso 1-palmitoylphosphatidylcholine with phospholipids: a 13C and 31P NMR study. Biochemistry. 1995;34:5666–5677. - PubMed

Publication types