Clinical Trial
. 2012 Aug 17;287(34):28986-9002.
doi: 10.1074/jbc.M111.319244. Epub 2012 Jun 29.

A novel dominant hyperekplexia mutation Y705C alters trafficking and biochemical properties of the presynaptic glycine transporter GlyT2

Affiliations
Clinical Trial

A novel dominant hyperekplexia mutation Y705C alters trafficking and biochemical properties of the presynaptic glycine transporter GlyT2

Cecilio Giménez et al. J Biol Chem. .

Abstract

Hyperekplexia or startle disease is characterized by an exaggerated startle response, evoked by tactile or auditory stimuli, producing hypertonia and apnea episodes. Although rare, this orphan disorder can have serious consequences, including sudden infant death. Dominant and recessive mutations in the human glycine receptor (GlyR) α1 gene (GLRA1) are the major cause of this disorder. However, recessive mutations in the presynaptic Na(+)/Cl(-)-dependent glycine transporter GlyT2 gene (SLC6A5) are rapidly emerging as a second major cause of startle disease. In this study, systematic DNA sequencing of SLC6A5 revealed a new dominant GlyT2 mutation: pY705C (c.2114A→G) in transmembrane domain 11, in eight individuals from Spain and the United Kingdom. Curiously, individuals harboring this mutation show significant variation in clinical presentation. In addition to classical hyperekplexia symptoms, some individuals had abnormal respiration, facial dysmorphism, delayed motor development, or intellectual disability. We functionally characterized this mutation using molecular modeling, electrophysiology, [(3)H]glycine transport, cell surface expression, and cysteine labeling assays. We found that the introduced cysteine interacts with the cysteine pair Cys-311-Cys-320 in the second external loop of GlyT2. This interaction impairs transporter maturation through the secretory pathway, reduces surface expression, and inhibits transport function. Additionally, Y705C presents altered H(+) and Zn(2+) dependence of glycine transport that may affect the function of glycinergic neurotransmission in vivo.


Figures
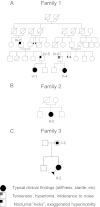
FIGURE 1.
FIGURE 1.
Pedigree of families 1 (A), 2 (B), and 3 (C). Individuals are numbered according to their position in the pedigree lines as I, II, III, and IV, and then each individual from left to right as 1, 2, 3, etc. Males and females are represented by squares and circles, respectively. Shaded symbols represent individuals with the Y705C mutation or who are/were affected, with clinical signs observed.
FIGURE 2.
FIGURE 2.
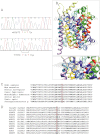
Genetic and structural analysis of the Y705C mutant. A, partial sequences of exon 15 from control and patient 1 DNAs, respectively. Note the heterozygous single-nucleotide polymorphism c.2114A→G changes the codon TAT to TGT, resulting in a pY705C substitution in GlyT2. B, molecular model of GlyT2 showing the localization of Tyr-705 in TM11. C, phylogenetic comparison of TM11 regions of GlyT2 containing the amino acid Tyr-705 (in red). D, sequence alignment of GlyT2 TM11 region in human SLC6 family members. Sequences were obtained from NCBI (www.ncbi.nlm.nih.gov) and were aligned using ClustalW software and MUSCLE alignment server.
FIGURE 3.
FIGURE 3.
Glycine transport and electrophysiological characterization of wild-type GlyT2 and the Y705C mutant. A, COS7 cells expressing the indicated transporters were assayed for 3[H]glycine transport during 10 min in HBS containing 150 mm NaCl in the presence of increasing glycine concentrations from 0.5 to 1 mm. Experimental data were fitted to hyperbolae. Kinetic parameters are indicated on the graph. *, significantly different from wild-type GlyT2, p < 0.05 in Student's t test. B, inward currents evoked by glycine in representative oocytes expressing wild-type GlyT2 or the Y705C mutant. The cells were voltage-clamped at −40 mV, and 1 mm glycine was superfused for the period indicated by the solid bar. Histogram represents arithmetic means ± S.E. (n = 5–10 oocytes) of normalized inward currents for wild-type GlyT2 and the Y705C mutant. *, significantly different from wild-type GlyT2, p < 0.05 in Student's t test. C, current-voltage plots of the glycine-mediated inward currents of wild-type GlyT2 and Y705C mutant determined by subtracting, in each case, the currents observed in the absence of glycine.
FIGURE 4.
FIGURE 4.
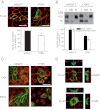
Cell and plasma membrane expression of wild-type GlyT2 and Y705C. A, immunofluorescence quantification of plasma membrane transporters. Wild-type EGFP-tagged GlyT2 or Y705C expressed in MDCK cells for 48 h were immunolabeled for the plasma membrane marker E-cadherin (E-cad). Two channel confocal images were obtained (green for GlyT2 and red for E-cadherin), and regions occupied by E-cadherin were taken as plasma membrane and regions inside the cadherin staining were taken as intracellular, using the Image J ROI manager. After applying an automatic threshold to adjust images, the fluorescence intensity was measured separately for membrane and intracellular regions, and the percentage of transporter in plasma membrane was calculated (histogram). This process was performed at least in 150 cells/condition. *, p < 0.05 values calculated using Student's t test by comparing wild-type GlyT2 with the Y705C mutant. B, COS7 cells expressing wild-type GlyT2 or Y705C mutant were subjected to biotinylation as described under “Experimental Procedures.” 8 μg of total (lanes T) and nonbiotinylated proteins (lanes NB) and 24 μg of biotinylated proteins (lanes B) were subjected to Western blotting for GlyT2 detection, and the membranes were reprobed for calnexin immunoreactivity as a loading control. Lower panel, densitometric analysis. Black bars, total transporter that was biotin-labeled (B as a % of T) as percentage of that of wild-type GlyT2. Open bars, mature/immature transporter ratio (100 kDa/75 kDa) as a percentage of the ratio (100 kDa/75 kDa) for wild-type GlyT2. *, p < 0.05 in Student's t test. C, MDCK cells expressing wild-type EGFP-tagged GlyT2 or Y705C were immunolabeled for calnexin (CNX, endoplasmic reticulum marker) or early endosome antigen 1 (EEA1, early endosome marker). No significantly difference in co-localization was observed. D, MDCK cells transfected with wild-type EGFP-tagged GlyT2 or Y705C were plated on cell culture filter inserts and grown to confluence. Samples were examined by laser scanning confocal microscopy. Left panel, en face views. Right panel, x-z cross-sections. The x-z cross-sections are derived from the indicated transept lines.
FIGURE 5.
FIGURE 5.
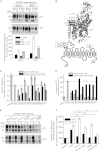
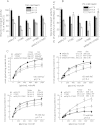
Substitution analysis of Tyr-705 and effect of DTT on glycine transport. Transiently transfected COS7 cells expressing wild-type GlyT2 or mutants with the indicated amino acids at position 705, were subjected to biotinylation as described in Fig. 4 to determine plasma membrane expression (A) or treated with vehicle or 12 mm DTT (B) or 2.5 mm DTT (D) or the specified concentrations of the indicated reducing agents (C) and then assayed for [3H]glycine transport. In B, * indicates significantly different from wild-type GlyT2, p < 0.05 in Student's t test. In C and D, ** indicates p < 0.01, and * indicates p < 0.05 by analysis of variance. Lanes T, total proteins; lanes NB, nonbiotinylated proteins; lanes B, biotinylated proteins.
FIGURE 6.
FIGURE 6.
Effect of DTT on Y705C plasma membrane expression. COS7 cells expressing wild-type GlyT2 or Y705C were treated with 12 mm DTT at 22 °C for the indicated times and then assayed for [3H]glycine transport for 10 min (A) or subjected to sulfo-NHS-SS-biotinylation as described under “Experimental Procedures” (B). A, transport data are expressed as percentages of wild-type GlyT2 transport activity, which was 2.8 ± 0.3 nmol of Gly/mg of protein/10 min. *, significantly different from no DTT, p < 0.05 in Student's t test. B, upper panel, Western blot for GlyT2 detection of a SDS-PAGE loaded with 8 μg of total (lanes T) and nonbiotinylated proteins (lanes N) and 24 μg of biotinylated proteins (lanes B). Lower panel, densitometric analysis. *, significantly different from no DTT, p < 0.05 in Student's t test. C, MDCK cells expressing wild-type EGFP-tagged GlyT2 or Y705C were treated for 30 min with 12 mm DTT, placed on ice to stop trafficking, and immunolabeled for the plasma membrane marker E-cadherin (E-cad). D, co-localization of transporter and marker was performed as described for Fig. 4. *, p < 0.05 values calculated using Student's t test by comparing wild-type GlyT2 with the Y705C mutant.
FIGURE 7.
FIGURE 7.
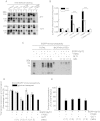
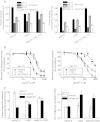
MTSEA-biotin labeling and transport activity of Y705C and GlyT2 cysteine mutants. A, COS7 cells expressing wild-type GlyT2 or Y705C were treated with vehicle or 50 mm N-ethylmaleimide (NEM) for 10 min, washed, and treated with HBS or 12 mm DTT in HBS for 30 min, washed, and subjected to MTSEA-biotinylation as described under “Experimental Procedures.” Upper panel, Western blot for GlyT2 detection of a SDS-PAGE loaded with 10 μg of total (lanes T) and 100 μg of biotinylated proteins (lanes B). Lower panel, densitometric analysis of the percentage of total transporter (B as a % of T) that was MTSEA-biotin-labeled in each condition as percentage of control wild-type GlyT2. ***, Significantly different from wild-type GlyT2, p < 0.001 in Student's t test. B, upper panel, molecular model of GlyT2 showing the localization of Tyr-705 and some of the endogenous cysteines (black). Lower panel, location of the Cys-311–Cys-320 pair in the second external loop as compared with Cys-705 on schematic GlyT2 secondary structure. C and D, effect of DTT on glycine transport by cysteine to serine mutants in the background of wild-type GlyT2 or the Y705C mutant. COS7 cells expressing wild-type GlyT2, Y705C, cysteine to serine mutants (CXS), or Y705C/cysteine to serine double mutants (CXS/Y705C) for 48 h were assayed for [3H]glycine transport for 10 min after being treated with vehicle (C) or with 12 mm DTT at 22 °C for 5 min (D). E, COS7 cells expressing the indicated transporters were treated with vehicle (−DTT) or DTT (+DTT) for 30 min, washed, and MTSEA-biotin-labeled; streptavidin-agarose bound proteins were run in nonreducing (−DTT) or reducing (+DTT) SDS-PAGE and subjected to Western blotting as above. F, densitometric analysis of the percentage of total transporter that was MTSEA-biotin-labeled in each condition. For clarity, this was expressed as percentage of the respective wild-type GlyT2 in each condition. Significantly different from the Y705C single mutant: *, p < 0.05; **, p < 0.01 in Student's t test.
FIGURE 8.
FIGURE 8.
Surface labeling and co-expression of Y705C and GlyT2 cysteine mutants. A, COS7 cells expressing the indicated transporters were treated with vehicle (−DTT) or DTT (+DTT) for 30 min, washed, and subjected to NHS-SS-biotinylation as in Fig. 4B. Lanes T, total proteins; lanes B, biotinylated proteins. B, densitometric analysis of three blots as in A showing the immunoreactivity of 200-kDa dimers (band marked with asterisk in A) normalized by the total transporter immunoreactivity. ***, significantly different from the respective single mutant, p < 0.01 in Student's t test. C, effect of wild-type GlyT2 and Y705C on transporter expression. COS7 cells expressing wild-type GlyT2 or Y705C tagged with EGFP as described in Ref. at the indicated ratios (increasing mutant cDNA) were assayed for [3H]glycine transport and in parallel subjected to NHS-SS-biotinylation as described under “Experimental Procedures” except anti-EGFP antibody was used for the Western blots. D, effect of the expression of Y705C on EGFP-GlyT2 expression (densitometric analysis of blots as in C) and transport activity. E, effect of the expression of Y705C on EGFP-GlyT2 surface expression.
FIGURE 9.
FIGURE 9.
Effect of pH on glycine transport by wild-type GlyT2 and the Tyr-705 mutant. Transiently transfected COS7 cells expressing wild-type GlyT2 or mutants with the indicated amino acid substitutions at position 705 were assayed for [3H]glycine transport for 5 min in HBS containing 150 (A and C) or 75 (B and C) mm NaCl at 10 μm or the indicated final glycine concentration and pH. Control GlyT2 transport values at pH 7.4 were 1.4 ± 0.2 and 0.73 ± 0.1 nmol of Gly/mg of protein/5 min at 150 and 75 mm NaCl, respectively. Mean pH change was significantly different from wild-type GlyT2. *, p < 0.05 by analysis of variance with Dunnett's post hoc test. C, kinetics of glycine transport at low pH. COS7 cells expressing wild-type GlyT2, the Y705C mutant, or the indicated combination of the respective cDNAs were assayed for [3H]glycine transport at pH 7.4 or 5.4 for 5 min in HBS containing 150 or 75 mm NaCl and glycine concentrations increasing from 0.5 μm to 1 mm. Experimental data were fitted to hyperbolae. The kinetic parameters are indicated on the graphs. Mean pH change significantly different from wild-type GlyT2. *, p < 0.05 in Student's t test.
FIGURE 10.
FIGURE 10.
Effect of Zn2+ on glycine transport by wild-type GlyT2 and the Y705C mutant. Transiently transfected COS7 cells expressing wild-type GlyT2, the Y705C mutant, or the indicated combinations of the respective cDNAs were assayed for [3H]glycine transport for 5 min in HBS containing 75 mm NaCl at the indicated pH and 10 μm final glycine concentration (A and B) or increasing glycine concentrations (C) in the presence of the indicated ZnCl concentrations (A–C). NaCl was isotonically substituted by choline chloride. B, dose-response data were fit to logistic curves. C, transport data were fitted to hyperbolae, and kinetic parameters were obtained from the best fit. Mean change significantly different from wild-type GlyT2. *, p < 0.05 in Student's t test.

Similar articles

Cited by

References

    1. Aragón C., López-Corcuera B. (2003) Structure, function and regulation of glycine neurotransporters. Eur. J. Pharmacol. 479, 249–262 - PubMed
    1. Gomeza J., Hülsmann S., Ohno K., Eulenburg V., Szöke K., Richter D., Betz H. (2003) Inactivation of the glycine transporter 1 gene discloses vital role of glial glycine uptake in glycinergic inhibition. Neuron 40, 785–796 - PubMed
    1. Aragón C., López-Corcuera B. (2005) Glycine transporters. Crucial roles of pharmacological interest revealed by gene deletion. Trends Pharmacol. Sci. 26, 283–286 - PubMed
    1. Gomeza J., Ohno K., Hülsmann S., Armsen W., Eulenburg V., Richter D. W., Laube B., Betz H. (2003) Deletion of the mouse glycine transporter 2 results in a hyperekplexia phenotype and postnatal lethality. Neuron 40, 797–806 - PubMed
    1. Gomeza J., Ohno K., Betz H. (2003) Glycine transporter isoforms in the mammalian central nervous system. Structures, functions and therapeutic promises. Curr. Opin. Drug Discov. Devel. 6, 675–682 - PubMed

Publication types

MeSH terms