

Review
doi: 10.3174/ajnr.A2677.
Epub 2011 Sep 15.
Neuroimaging features of neurodegeneration with brain iron accumulation
Affiliations
- PMID: 21920862
- PMCID: PMC7966445
- DOI: 10.3174/ajnr.A2677
Item in Clipboard
Review
Neuroimaging features of neurodegeneration with brain iron accumulation
AJNR Am J Neuroradiol.
2012 Mar.
Abstract
NBIA characterizes a class of neurodegenerative diseases that feature a prominent extrapyramidal movement disorder, intellectual deterioration, and a characteristic deposition of iron in the basal ganglia. The diagnosis of NBIA is made on the basis of the combination of representative clinical features along with MR imaging evidence of iron accumulation. In many cases, confirmatory molecular genetic testing is now available as well. A number of new subtypes of NBIA have recently been described, with distinct neuroradiologic and clinical features. This article outlines the known subtypes of NBIA, delineates their clinical and radiographic features, and suggests an algorithm for evaluation.
Figures
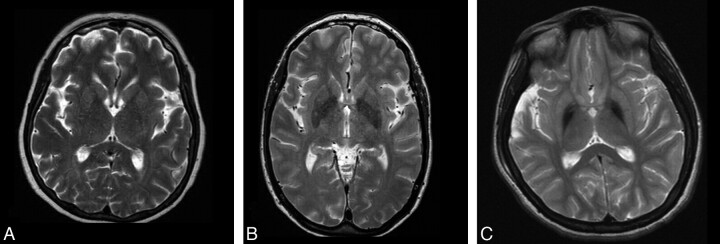
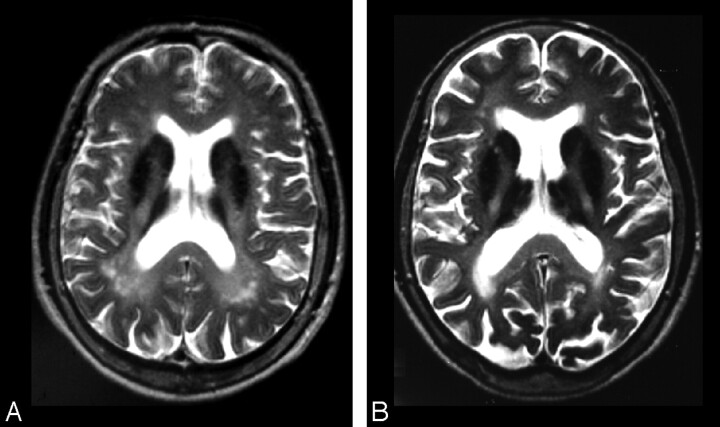
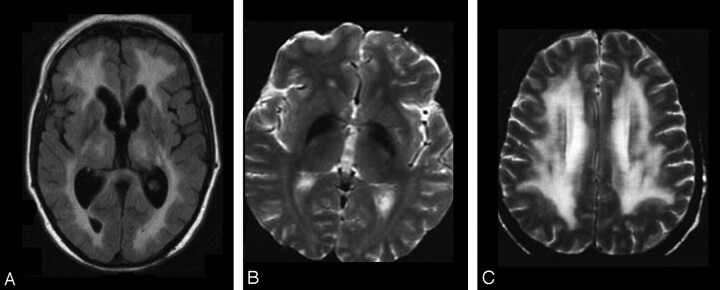
T2-weighted MR imaging appearance of a healthy 60-year-old woman (A), a 66-year-old woman with idiopathic Parkinson disease (B), and a 16-year-old female patient with idiopathic NBIA (C) obtained on a 1.5T scanner by using standard clinical TEs and TRs.
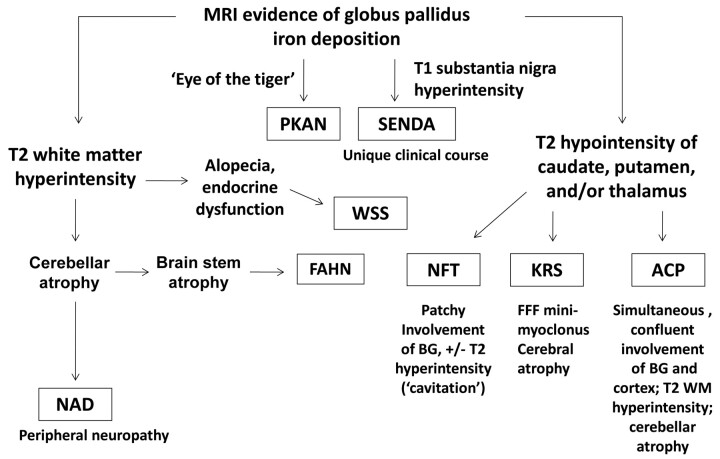
A clinical- and neuroimaging-based algorithm for evaluating patients with suspected NBIA. BG indicates basal ganglia; WM, white matter; FFF, facial-faucial-finger.
PKAN. A and B, The eye-of-the-tiger sign begins with T2 hyperintensity within the globus pallidus. C and D, Iron subsequently accumulates with time. Cerebral and/or cerebellar atrophy and white matter hyperintensity are not typical features.
NFT. A, Patchy hypointensity is typically seen within multiple deep gray nuclei, including the caudate, putamen, globus pallidus, and thalamus in symptomatic cases. B, Concurrent T2 hyperintensities (cavitation) may be seen within regions of hypointensity. Images courtesy of P.F. Chinnery.
NAD. Iron deposition may be seen in the globus pallidus (A) and the substantia nigra (B) on T2* and T2 images. C, Confluent white matter hyperintensities may be seen on fluid-attenuated inversion recovery sequences as well. D, Global cerebellar atrophy is a frequent feature.
ACP. A and B, More homogeneous iron deposition is seen within the basal ganglia, with juxtaposed confluent white matter hyperintensities on T2-weighted sequences. Images courtesy of H. Miyajima.
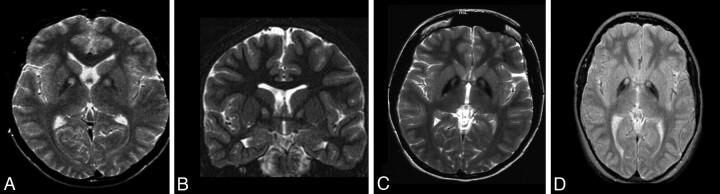
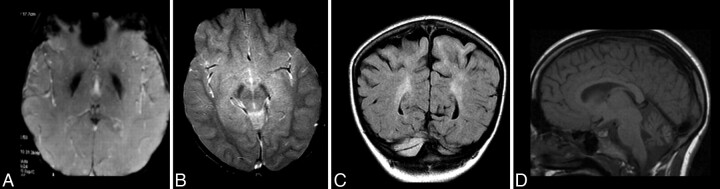
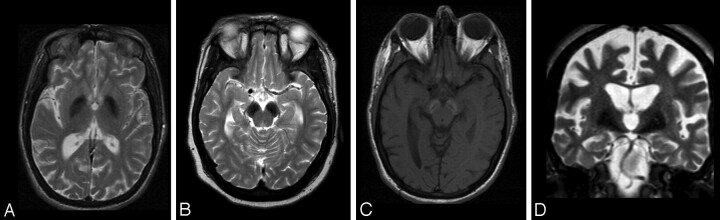
FAHN. Evidence of iron deposition in the globus pallidus (A) and, to a lesser extent, the substantia nigra (B) may be seen on T2-weighted images. C, Confluent white matter abnormalities may be apparent on T2/fluid-attenuated inversion recovery sequences. D, Mild cerebral atrophy may occur, along with significant pontocerebellar atrophy and thinning of the corpus callosum (A).
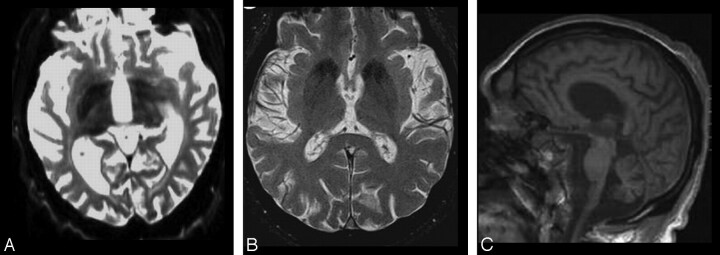
KRS. Globus pallidus, caudate, and putamen hypointensity may be seen on T2-weighted images (A and B), in addition to generalized cerebral and cerebellar atrophy (A and C).
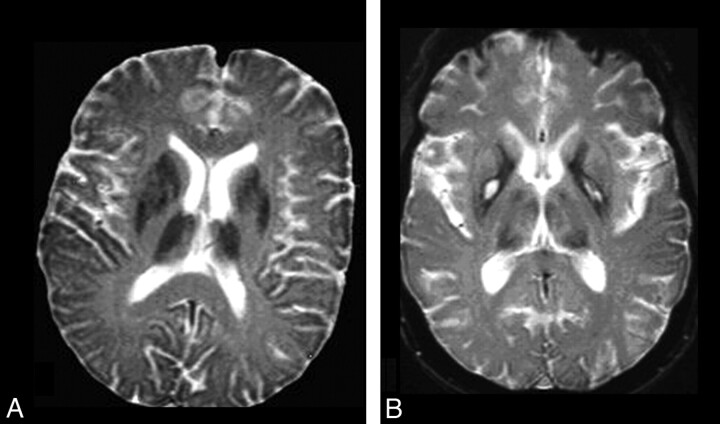
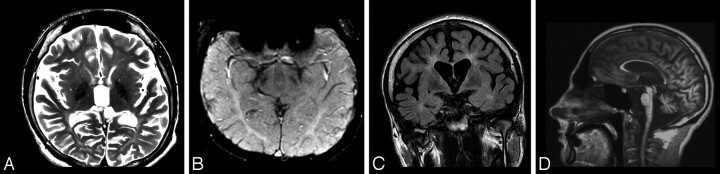
WSS. Extensive confluent white matter T2 hyperintensity is typical of the disorder (A and C), while hypointensity of the globus pallidus on T2 sequences is an inconsistent feature (B). Images courtesy of S. Bohlega.
SENDA. Hypointensity of the globus pallidus (A) is overshadowed by that of the substantia nigra and cerebral peduncles (B) on T2-weighted imaging. C, T1 sequences demonstrate hyperintensity of the substantia nigra and cerebral peduncles with central linear hypointensity. D, Global cerebral atrophy is also a feature.
Similar articles
-
Neurodegeneration with Brain Iron Accumulation: Clinicoradiological Approach to Diagnosis.J Neuroimaging. 2015 Jul-Aug;25(4):539-51. doi: 10.1111/jon.12195. Epub 2014 Dec 24. J Neuroimaging. 2015. PMID: 25545045 Review.
-
MRI of neurodegeneration with brain iron accumulation.Curr Opin Neurol. 2020 Aug;33(4):462-473. doi: 10.1097/WCO.0000000000000844. Curr Opin Neurol. 2020. PMID: 32657887 Review.
-
Brain iron accumulation in dysmetabolic iron overload syndrome with restless legs syndrome.Sleep Med. 2014 Aug;15(8):1004-5. doi: 10.1016/j.sleep.2014.03.018. Epub 2014 May 6. Sleep Med. 2014. PMID: 24951089 No abstract available.
-
Neurodegeneration with brain iron accumulation - clinical syndromes and neuroimaging.Biochim Biophys Acta. 2012 Mar;1822(3):350-60. doi: 10.1016/j.bbadis.2011.06.016. Epub 2011 Jul 13. Biochim Biophys Acta. 2012. PMID: 21782937 Review.
-
New NBIA subtype: genetic, clinical, pathologic, and radiographic features of MPAN.Neurology. 2013 Jan 15;80(3):268-75. doi: 10.1212/WNL.0b013e31827e07be. Epub 2012 Dec 26. Neurology. 2013. PMID: 23269600 Free PMC article.
Cited by
-
Pathophysiology and treatment of neurodegeneration with brain iron accumulation in the pediatric population.Curr Treat Options Neurol. 2013 Oct;15(5):652-67. doi: 10.1007/s11940-013-0254-5. Curr Treat Options Neurol. 2013. PMID: 23888388
-
Brain MR Imaging Findings in Woodhouse-Sakati Syndrome.AJNR Am J Neuroradiol. 2018 Dec;39(12):2256-2262. doi: 10.3174/ajnr.A5879. Epub 2018 Nov 8. AJNR Am J Neuroradiol. 2018. PMID: 30409855 Free PMC article.
-
Novel WDR45 mutation causing beta-propeller protein associated neurodegeneration (BPAN) in two monozygotic twins.J Neurol. 2017 May;264(5):1020-1022. doi: 10.1007/s00415-017-8475-2. Epub 2017 Mar 30. J Neurol. 2017. PMID: 28361255 No abstract available.
-
Iron metabolism in diabetes-induced Alzheimer's disease: a focus on insulin resistance in the brain.Biometals. 2018 Oct;31(5):705-714. doi: 10.1007/s10534-018-0134-2. Epub 2018 Jul 24. Biometals. 2018. PMID: 30043289 Free PMC article. Review.
-
A Case with Beta-Propeller Protein Associated Neurodegeneration with Smooth Response to Levodopa Treatment.Mov Disord Clin Pract. 2018 Mar 23;5(3):327-329. doi: 10.1002/mdc3.12604. eCollection 2018 May-Jun. Mov Disord Clin Pract. 2018. PMID: 30800705 Free PMC article. No abstract available.
References
-
- Yilmaz A, Budak H, Longo R. Paramagnetic contribution of serum iron to the spin-lattice relaxation rate (1//'1) determined by MRI. Appl Magn Reson 1998; 14: 51– 58
-
- Burgetova A, Seidl Z, Krasensky J, et al. . Multiple sclerosis and the accumulation of iron in the basal ganglia: quantitative assessment of brain iron using MRI t(2) relaxometry. Eur Neurol 2010; 63: 136– 43 - PubMed
-
- Miszkiel KA, Paley MN, Wilkinson ID, et al. . The measurement of R2, R2* and R2′ in HIV-infected patients using the prime sequence as a measure of brain iron deposition. Magn Reson Imaging 1997; 15: 1113– 19 - PubMed
-
- Waldvogel D, van Gelderen P, Hallett M. Increased iron in the dentate nucleus of patients with Friedrich's ataxia. Ann Neurol 1999; 46: 123– 25 - PubMed
Publication types
MeSH terms
Grants and funding
LinkOut - more resources
Full Text Sources
Medical